2-Grid Vector Map
2-grid vector maps use two separate grid files to determine the vector direction and magnitude. The grids can contain Cartesian or polar data. With Cartesian data, one grid consists of X component data and the other grid consists of Y component data. With polar data, one grid consists of angle information and the other grid contains length information.
|
|
|
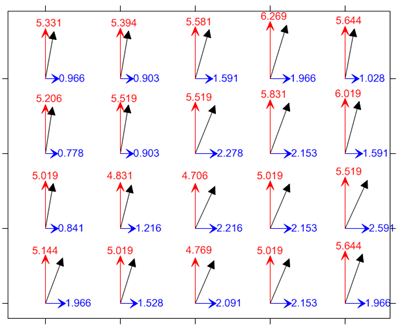
This map shows two Cartesian grid files. The blue vectors are X component grid values. The red vectors are Y component grid values. The black is the vector that Surfer plots when the two grids are specified when creating a 2-grid Cartesian vector map. |
Creating a 2-Grid Vector Map
To create a 2-grid vector map:
- Use the Home | New Map | Specialty | 2-Grid Vector command or the
 button.
 - Select the first grid file in the Open Grid dialog. This is the X component or Angle component grid file. Click Open.
- Select the second grid file in the Open Grid dialog. This is the Y component or the Length component grid file. Click Open.
The map is automatically created with reasonable defaults.
Editing an Existing 2-Grid Vector Map
To change the features of the 2-grid vector map, click once on the 2-grid vector map in the plot window or the Contents window. The properties are displayed in the Properties window.
Adding a Map Layer
When vector maps are created, they are independent of other maps in the plot window. For example, creating a vector map while a contour map is present in the plot window yields two separate maps, each with its own set of axes and scaling parameters. To create a single map with the vector map on the contour map, select both maps by clicking the Select All command. Overlay the maps using the Map Tools | Map Tools | Overlay Maps command.
Alternatively, you can add the vector map directly to the existing contour map by creating the vector map using the Home | Add to Map | Layer | 2-Grid Vector command. This automatically adds the vector map to the contour map axes.
Another alternative, is to create both maps using the Home | New Map commands. Then, select one map and drag the map layer to the other map object. This is equivalent to using the Overlay Maps command to overlay maps. For example, create a contour map with the Home | New Map | Contour command. Create the vector map using the Home | New Map | Specialty | 2-Grid Vector command. This creates two separate maps. Click on the vector map, hold down the left mouse button, and drag the vector map into the contour map. A single map with two map layers, using one set of axes and scaling parameters is created.
Any number of vector maps can be combined with any other map layers.
2-Grid Vector Map Properties
The 2-grid vector map layer properties contains the following pages:
Map Properties
The map properties contains the following pages: