1-Grid Vector Map
Vector map information, direction and magnitude, can be derived from one grid. The arrow symbol points in the "downhill" direction and the length of the arrow depends on the magnitude, or steepness, of the slope. A vector is drawn at each grid node unless some nodes are skipped by changing the Frequency setting on the Symbol page in the vector map properties.
For example, consider a grid containing elevation information. If water were poured over the surface, the direction arrows would point in the direction water flows - from high elevation to low elevation. Magnitude is indicated by arrow length. In the water flow example, the steeper slopes would have longer arrows.
|
|
|
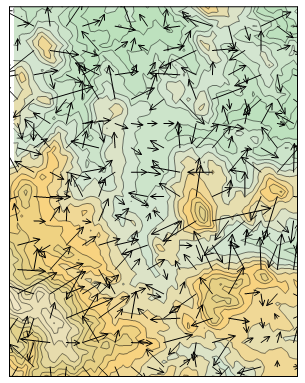
This vector map is overlaid on a filled contour map. Longer arrows indicate areas of steeper slope. |
Creating a 1-Grid Vector Map
To create a 1-grid vector map:
- Click the Home | New Map | Specialty | 1-Grid Vector command or the
 button.
 - Select a grid file in the Open Grid dialog and click Open.
-
If the selected file is in a format that supports 3D grids (e.g. VTK, HDF) the Data Type dialog will be displayed.
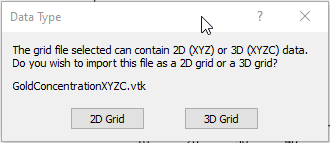
Click 2D Grid to import XYZ data or click 3D Grid to import an XYZC lattice with slice controls. If 2D grid is selected for a 3D grid file, the bottom slice (lowest Z value) will be imported.
The map is automatically created with reasonable defaults.
Editing a 1-Grid Vector Map
To change the features of the vector map, click once on the vector map in the plot window or in the Contents window to select it. The properties are displayed in the Properties window.
Adding a Map Layer
When vector maps are created, they are independent of other maps in the plot window. For example, creating a vector map while a contour map is present in the plot window yields two separate maps, each with its own set of axes and scaling parameters. To create a single map with the vector map on the contour map, select both maps by clicking the Select All command. Overlay the maps using the Map Tools | Map Tools | Overlay Maps command.
Alternatively, you can add the vector map directly to the existing contour map by creating the vector map using the Home | Add to Map | Layer | 1-Grid Vector command. This automatically adds the vector map to the contour map axes.
Another alternative, is to create both maps using the Home | New Map commands. Then, select one map and drag the map layer to the other map object. This is equivalent to using the Overlay Maps command to overlay maps. For example, create a contour map with the Home | New Map | Contour command. Create the vector map using the Home | New Map | Specialty | 1-Grid Vector command. This creates two separate maps. Click on the vector map, hold down the left mouse button, and drag the vector map into the contour map. A single map with two map layers, using one set of axes and scaling parameters is created.
Any number of vector maps can be combined with any other map layers.
1-Grid Vector Map Properties
1-grid vector map layers contain the following property pages:
Map Properties
The map properties contains the following pages: