Watershed Layer General Properties
To edit a watershed map, click once on the watershed map layer to select it. The properties for the watershed layer are displayed in the Properties window. The watershed properties General page contains the following options:
|
|
|
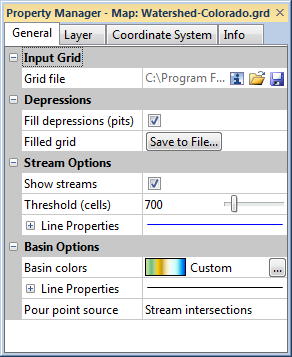
Change watershed layer properties in the Properties window on the General page. |
Input Grid
The Grid file displays the path and file name for the grid file used for the map. If the entire file name is not shown, place the mouse over the file name. A small window will appear with the full path and name displayed.
Grid Information
The ![]() button displays information about the grid file used to produce the map layer. The information includes the grid size, the minimum and maximum X, Y, Z, and C values contained in the grid file, and statistics. If the grid file contains more than 40 million nodes, you are asked if you wish to create a detailed report or a quick report. Click Yes in the message to create a detailed grid report, or click No to create a shorter quick grid report.
button displays information about the grid file used to produce the map layer. The information includes the grid size, the minimum and maximum X, Y, Z, and C values contained in the grid file, and statistics. If the grid file contains more than 40 million nodes, you are asked if you wish to create a detailed report or a quick report. Click Yes in the message to create a detailed grid report, or click No to create a shorter quick grid report.
Change File
The ![]() button displays the Open Grid dialog. This allows you to select a new grid file, or an updated version of the grid file used to create the contour map. Select a grid file and click Open. If the Z range for the new grid is outside the old contour levels, you will be prompted to continue the operation. If you clickCancel, the grid file is not replaced. If you clickOK, the grid file is replaced, but no contour lines are drawn. You can update the contour levels being displayed on theLevelstab.
button displays the Open Grid dialog. This allows you to select a new grid file, or an updated version of the grid file used to create the contour map. Select a grid file and click Open. If the Z range for the new grid is outside the old contour levels, you will be prompted to continue the operation. If you clickCancel, the grid file is not replaced. If you clickOK, the grid file is replaced, but no contour lines are drawn. You can update the contour levels being displayed on theLevelstab.
If the new grid exceeds the current map limits, another warning will appear asking you to adjust the map limits. If you click Yes, the limits are automatically adjusted to fit the new grid. If you click No, the limits are not automatically adjusted. The map may not be displayed. To change the map limits, click on the Map object in the Contents window and the Limits tab in the Properties window.
You may also see a warning message that the current map scale may result in an un-viewable map. Clicking OK allows the map scale to automatically be adjusted.
Coordinate System Note:
Regardless of the file selected with either the Map Tools | Reload | Map Data command or by clicking the ![]() button in the Properties window, the coordinate system for the original map layer is used after updating the file. If this is not the correct coordinate system, click on the map layer to select it. In the Properties window, click on the Coordinate System tab and set the coordinate system to the appropriate new system.
button in the Properties window, the coordinate system for the original map layer is used after updating the file. If this is not the correct coordinate system, click on the map layer to select it. In the Properties window, click on the Coordinate System tab and set the coordinate system to the appropriate new system.
Save File
The  button displays the Save Grid As dialog. Type a File name and change the Save as type to the desired grid file format. Click Save. If a coordinate system has been defined on the Coordinate System tab in the Properties window, an Export Options dialog appears. Check the desired file formats. It is recommend that GS Reference (Version 2) file option be checked to generate a .GSR2 file. Click OK and the file is saved.
If the map layer was created using a 3D grid, only 3D grid file formats (HDF, VTK, etc.) will be available in the Save as type field.
Grid Type
The Grid type field tells the user whether a 2D grid or 3D grid was used to create the map layer. This field is informational only.
Slice Z Value
The Slice Z value defines which horizontal slice of a 3D grid file is mapped. Click on the current value and enter a specific number to view the results for a that horizontal slice. Click and drag the slider to see the mapped results change as the slice value changes.
By default, Surfer will select a Z value near the middle of the range as the Slice Z value.
Save Slice
The Save Slice command saves the current horizontal slice of a 3D grid as a 3D grid file.
Click the button to display the Save Grid As dialog. Type a File name and change the Save as type to the desired grid file format. Click Save. If a coordinate system has been defined on the Coordinate System tab in the Properties window, an Export Options dialog appears. Check the desired file formats. It is recommend that GS Reference (Version 2) file option be checked to generate a .GSR2 file. Click OK and the file is saved.
Depressions
The Depressions section contains the option to fill the depressions and save the volume added by the fill in a grid file. Depressions are local "pits" or low points in the grid where water naturally accumulates and stops because there is no downhill path to an outlet.
Fill Depressions
Check the box next to the Fill depressions (pits) to mathematically fill all depressions in the grid. This option determines how Surfer handles these pits and drastically alters the flow of water and basin generation:
-
Unchecked (Not Filled): Water flows into the depression and stops. This allows the flow to terminate in these sinks. This often results in many small, isolated basins because the flow never reaches a major river outlet.
-
Checked (Filled): Surfer fills these local pits so water can continue to flow across the surface. The depressions are filled to the elevation level of the lowest surrounding cell that drains. The resulting filled surface is completely flat because all cells within the depression are set to equal that lowest draining cell—analogous to what would happen if you filled the physical depression with a giant water hose until it overflowed. This allows the water to continue moving downhill to a common outlet, typically resulting in larger, more consolidated basins.
Filled Grid
Click the Save to File button next to Filled grid to save the depressions to a grid file. The resulting grid file has the node value in depressions changed to match the lowest value of surrounding grid nodes. This makes the surface flat in these depression areas. The Save to File button is disabled when Fill depressions (pits) is unchecked.
Stream Options
The Stream Options section controls how streams are calculated based on the amount of flow into the grid cell from all surrounding grid cells.
Show Streams
Check the box next to Show streams to draw the drainages with flow values greater than or equal to the Threshold (cells) value. Set the line properties for the streams in the Line Properties section.
Threshold (cells)
To understand this setting, it helps to know how Surfer defines a "cell" for these calculations. While a grid node is a single point location with a Z value, a cell is a square or rectangular area centered on that grid node . This cell area extends halfway to the neighboring grid nodes in all four directions. Any drop of water that falls within this cell boundary follows the flow direction calculated for that central node.
The Threshold (cells) value specifies the number of upstream cells that must flow into a specific cell before a stream line is created. A stream starts when the total number of upstream cells draining through a given cell meets or exceeds this specified threshold number. Higher values create fewer streams and basins. Lower values create more streams and basins.
Line Properties
Click the ![]() next to Line Properties to set the stream line properties, including style, color, opacity, and width.
next to Line Properties to set the stream line properties, including style, color, opacity, and width.
Basin Options
Basin areas are areas that drain water to the stream. You can set the basin colors and the pour point source in the Basin Options section by clicking the ![]() next to Basin Options to open the section.
next to Basin Options to open the section.
Basin Colors
The Basin colors option controls the colors used for creating the watershed basin areas. To change the colors, click on the color bar next to Basin colors. Select one of the predefined colormaps from the list. To create custom colors, click on the ![]() button to the right of the selected colormap to open the Colormap Editor.
button to the right of the selected colormap to open the Colormap Editor.
Surferapplies a custom algorithm to determine how many colors are needed so that no adjacent basins have the same color. This algorithm usually determines that between three and six colors are necessary. Once the number of colors is determined, the selected colormap is sampled to choose the colors. The colormap ranges in value from 0 to 1. The first color is picked at a value of 0 on the left side of the colormap. The second color is picked 1/10th to the right on the colormap at a value of 0.1. The third color is picked at a value of 0.2, the fourth at 0.3, and so on. With most colormaps, this provides a smooth transition of colors for the basins in the watershed map.
Basin Colors Example
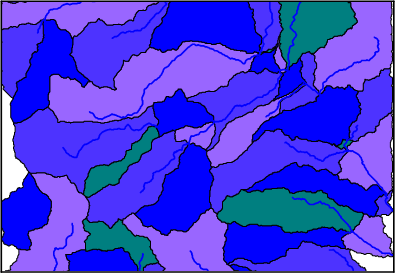
Consider this watershed map and the Rainbowcolormap.
|
|
|
The watershed is filled with four colors, ranging from a purple to green. |
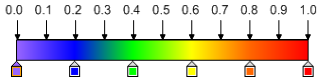
Because the watershed requires four colors, the colors at 1/10th increments (at values 0.0, 0.1, 0.2, and 0.3) are selected to fill the basins. These correspond to the light purple, blue-purple, blue, and blue-green colors.
|
|
|
The colors at values of 0, 0.1, 0.2, and 0.3 are used for the watershed map above. |
If additional colors were needed, the green color at value 0.4, the yellow-green color at 0.5, the yellow color at 0.6, and the yellow-orange color at 0.7 would be used.
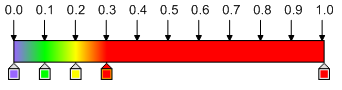
Because it is rare that more than six colors will ever be needed, the colors on the right side of the colormap are rarely used. If you want dramatically different colors for the watershed basins, you should vary the colors on the left side of the colormap. For instance, if the four colors for the map above should be purple, green, yellow, and red, the blue and orange nodes should be removed. The green and yellow nodes should be moved to the left, aligning with the 0.1 and 0.2 values. A new node should be added at a value of 0.3 with the color red. To determine the value a node is at, click on the node in the Colormap Editor. The Value is displayed at the top of the dialog.
|
|
|
Setting a variety of colors on the left side of the colormap will result in more differentiation in the watershed basin colors. |
Line Properties
Click the ![]() next to Line Properties to set the basin boundary line properties, including style, color, opacity, and width.
next to Line Properties to set the basin boundary line properties, including style, color, opacity, and width.
Pour Point Source
Pour points are the outlets of the stream systems and are calculated at all drainage intersections and where the drainage leaves the edge of the grid. The pour points can be generated automatically or selected from a file. Surfer uses the eight-direction pour point algorithm to calculate the flow direction at each grid node.
To change the Pour point source, click on the current option and select the desired option from the list. Available options are None, Stream intersections, and File. When set to None, the basins are not drawn or filled on the map. Only the streams appear. When set to Stream intersections, pour points are computed at the intersection of all tributary streams. When set to File, a .BLN file is imported that defines the locations where pour points should be located. The easiest way to create this file is to click on the map and click the Digitize command. Click on the map at the desired locations. Save the points to a .BLN file and load the file in the Pour point file option.
Too Many Pour Points
The maximum number of pour points is 65535. If you exceed the maximum number of pour points a "Too many pour points" or "Too many control points" error will be displayed. If the error occurs while Pour point source is set to Stream intersections , increase the Threshold (cells) value. If Pour point source is set to File , do not load a file with more than 65535 points.
Pour Point File
The Pour point file is used to define the pour points when the Pour point source is set to File. This .BLN file should contain point locations that are within the watershed map grid limits. To select the file, click on the ![]() button to the right of Pour point source. In the Open dialog, select the .BLN file and click Open.
button to the right of Pour point source. In the Open dialog, select the .BLN file and click Open.
Snap Pour Points
The Snap pour points option is used when the Pour point source is set to File. A common problem with using digitized points to define the pour points is locating the point slightly off the desired location, such as on the side of a hill. Checking this option moves the points in the Pour point file to if any of the eight neighboring grid node cells have a higher flow value. This allows more flow and better delineation of the basins.