3D Wireframe Layer General Properties
To edit a 3D wireframe, click once on the wireframe map to select it. The properties for the wireframe map are displayed in the Properties window. The 3D wireframe properties General page contains the following options:
|
|
|
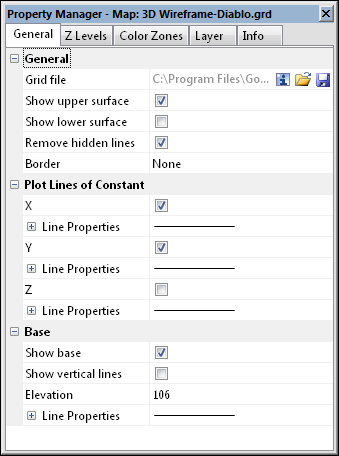
Change 3D wireframe map properties in the Properties window on the General page. |
General
Input Grid File
The Grid file displays the path and file name for the grid file used for the map. If the entire file name is not shown, place the mouse over the file name. A small window will appear with the full path and name displayed.
Grid Information
The ![]() button displays information about the grid file used to produce the map layer. The information includes the grid size, the minimum and maximum X, Y, Z, and C values contained in the grid file, and statistics. If the grid file contains more than 40 million nodes, you are asked if you wish to create a detailed report or a quick report. Click Yes in the message to create a detailed grid report, or click No to create a shorter quick grid report.
button displays information about the grid file used to produce the map layer. The information includes the grid size, the minimum and maximum X, Y, Z, and C values contained in the grid file, and statistics. If the grid file contains more than 40 million nodes, you are asked if you wish to create a detailed report or a quick report. Click Yes in the message to create a detailed grid report, or click No to create a shorter quick grid report.
Change File
The ![]() button displays the Open Grid dialog. This allows you to select a new grid file, or an updated version of the grid file used to create the contour map. Select a grid file and click Open. If the Z range for the new grid is outside the old contour levels, you will be prompted to continue the operation. If you clickCancel, the grid file is not replaced. If you clickOK, the grid file is replaced, but no contour lines are drawn. You can update the contour levels being displayed on theLevelstab.
button displays the Open Grid dialog. This allows you to select a new grid file, or an updated version of the grid file used to create the contour map. Select a grid file and click Open. If the Z range for the new grid is outside the old contour levels, you will be prompted to continue the operation. If you clickCancel, the grid file is not replaced. If you clickOK, the grid file is replaced, but no contour lines are drawn. You can update the contour levels being displayed on theLevelstab.
If the new grid exceeds the current map limits, another warning will appear asking you to adjust the map limits. If you click Yes, the limits are automatically adjusted to fit the new grid. If you click No, the limits are not automatically adjusted. The map may not be displayed. To change the map limits, click on the Map object in the Contents window and the Limits tab in the Properties window.
You may also see a warning message that the current map scale may result in an un-viewable map. Clicking OK allows the map scale to automatically be adjusted.
Coordinate System Note:
Regardless of the file selected with either the Map Tools | Reload | Map Data command or by clicking the ![]() button in the Properties window, the coordinate system for the original map layer is used after updating the file. If this is not the correct coordinate system, click on the map layer to select it. In the Properties window, click on the Coordinate System tab and set the coordinate system to the appropriate new system.
button in the Properties window, the coordinate system for the original map layer is used after updating the file. If this is not the correct coordinate system, click on the map layer to select it. In the Properties window, click on the Coordinate System tab and set the coordinate system to the appropriate new system.
Save File
The  button displays the Save Grid As dialog. Type a File name and change the Save as type to the desired grid file format. Click Save. If a coordinate system has been defined on the Coordinate System tab in the Properties window, an Export Options dialog appears. Check the desired file formats. It is recommend that GS Reference (Version 2) file option be checked to generate a .GSR2 file. Click OK and the file is saved.
If the map layer was created using a 3D grid, only 3D grid file formats (HDF, VTK, etc.) will be available in the Save as type field.
Grid Type
The Grid type field tells the user whether a 2D grid or 3D grid was used to create the map layer. This field is informational only.
Slice Z Value
The Slice Z value defines which horizontal slice of a 3D grid file is mapped. Click on the current value and enter a specific number to view the results for a that horizontal slice. Click and drag the slider to see the mapped results change as the slice value changes.
By default, Surfer will select a Z value near the middle of the range as the Slice Z value.
Save Slice
The Save Slice command saves the current horizontal slice of a 3D grid as a 3D grid file.
Click the button to display the Save Grid As dialog. Type a File name and change the Save as type to the desired grid file format. Click Save. If a coordinate system has been defined on the Coordinate System tab in the Properties window, an Export Options dialog appears. Check the desired file formats. It is recommend that GS Reference (Version 2) file option be checked to generate a .GSR2 file. Click OK and the file is saved.
Show Upper Surface
Check the Show upper surface box to display only the top portion of the surface. If the Remove hidden lines box is checked, only those portions of the upper surface not obscured by other portions of the surface are drawn.
Show Lower Surface
Check the Show lower surface box to display only the bottom of the surface. If the Remove hidden lines box is checked, only those portions where the bottom of the wireframe is not obscured by other portions of the surface are drawn. A base cannot be displayed when viewing the lower surface.
Remove Hidden Lines
Check the Remove hidden lines box to remove the display of X and Y lines behind other lines on the surface. When hidden lines are not removed, the wireframe has a transparent appearance.
Border
The Border option controls the display of the border line around the outside of the wireframe, at the intersection of the wireframe with the sides of the base. To change the border display, click on the existing option next to Border . Select the new option in the list. Options are to display the border on the Front Only, on All Sides, or on None of the sides. The border line is not visible on wireframes displaying both X and Y lines. The border line color is set in the Plot Lines of Constant section.
Plot Lines of Constant
The Plot Lines of Constant section allows you to specify the lines to be used when displaying the wireframe. Any combination of X, Y, and Z lines may be used. The properties on the Z Levels tab and Color Zones tab are only applied if the Plot Lines of Constant boxes are checked for the appropriate X, Y, or Z lines.
X Lines
Check the box next to X to display lines of constant X value on the wireframe.
Line Properties
Click the ![]() next to the Line Properties to open the line properties section for the X direction lines. Line Style, Color, Opacity, and Width can be altered. 3D wireframes do not support complex line styles.
next to the Line Properties to open the line properties section for the X direction lines. Line Style, Color, Opacity, and Width can be altered. 3D wireframes do not support complex line styles.
Y Lines
Check the box next to Y to display lines of constant Y value on the wireframe.
Line Properties
Click the ![]() next to the Line Properties to open the line properties section for the Y direction lines. Line Style, Color, Opacity, and Width can be altered. 3D wireframes do not support complex line styles.
next to the Line Properties to open the line properties section for the Y direction lines. Line Style, Color, Opacity, and Width can be altered. 3D wireframes do not support complex line styles.
Z Lines
Check the box next to Z to display lines of constant Z value on the wireframe.
If a 3D grid was used to create the wireframe map, lines of constant C value for the current Z slice will be drawn when this box is checked.
Line Properties
Click the ![]() next to the Line Properties to open the line properties section for the Z direction lines. Line Style, Color, Opacity, and Width can be altered. 3D wireframes do not support complex line styles.
next to the Line Properties to open the line properties section for the Z direction lines. Line Style, Color, Opacity, and Width can be altered. 3D wireframes do not support complex line styles.
Base
The Base section controls the display of a base on the wireframe. The base is the area "underneath" the wireframe. The bottom of the base can be drawn at any Z level relative to the surface.
Show Base
Check the Show base box to display the base. The base on a wireframe is the lines connecting the wireframe to the corners of the axes.
Show Vertical Lines
Add X and Y lines to the base by checking the Show vertical lines box.
Elevation
You can adjust the elevation of the base in the Elevation box. To change the elevation, highlight the existing value and type a new one.
Line Properties
Click the ![]() next to the Line Properties to open the line properties section for the base lines. Line Style, Color, Opacity, and Width can be altered. 3D wireframes do not support complex line styles.
next to the Line Properties to open the line properties section for the base lines. Line Style, Color, Opacity, and Width can be altered. 3D wireframes do not support complex line styles.