Grid Info
The Grids | Info | Grid Info command or the  button in the plot window allow you to select a .GRD file and display the file name, grid size in rows x columns, and grid X, Y, and Z minimums and maximums. If the grid file contains more than 40 million nodes, you are asked if you wish to create a detailed report or a quick report. Click Yes in the message to create a detailed grid report, or click No to create a shorter quick grid report. This is the same basic information as displayed in the Grid Editor window with the Grid Editor | Options | Grid Info command.
The Open Grid dialog also displays the Grid Info of the selected grid. The Open Grid dialog displays the following Grid Info: Name, Format, Size, xMax, yMax, zMax, xMin, yMin, and zMin.
Grid Info Dialog
The Grid Info dialog is displayed after clicking the Grid Info command or the button.
|
|
|
Select the grid for calculating grid statistics. |
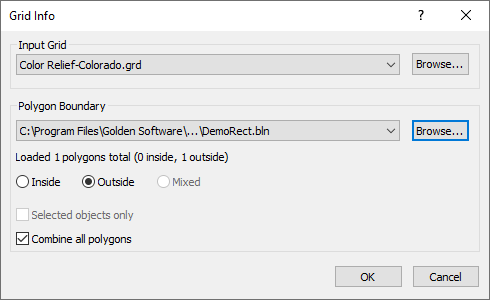
Input Grid
Specify the source map layer or grid file in the Input Grid section. Click the current selection and select a map layer from the list. Only map layers created from grid files are included in the Input Grid list. Click Browse to load a grid file with the Open Grid dialog.
Polygon Boundary
Specify the region or regions from which to calculate the statistics in the Polygon Boundary section. Select either a map layer or vector file in the Polygon Boundary section:
- Click the current selection and select a base layer from the list. Only base layers that contain at least one polygon or polyline will be included in the list. The base layer must use the same source coordinate system as the grid.
- Click Browse to load a vector file with the Open dialog. The file must use the same coordinate system as the grid.
The number of polygons and vertices is displayed below the Polygon boundary once a file or map layer has been selected. If the boundaries have blanking flags or BLN_Flag attributes, the total number of inside and outside flags is displayed.
Polyline Boundaries
Polylines can be used for polygon boundaries. The polylines in the base layer or vector file will be treated as polygons while assigning regions for calculating statistics. The Grid Info command is not recommended with open polylines, unexpected results my occur. Consider converting polylines to polygons with the Polyline to Polygon command and editing features with the Reshape command.
If the layer you wish to use contains both polygons and polylines, but you only wish to use some or all of the polygons, select the objects you wish to use before clicking Grids | Info | Grid Info and select the Selected objects only option. If the file you wish to use contains both polylines and polygons, first load the file as a base layer, and then use the Grid Info command with the Selected objects only option.
Inside, Outside, or Mixed
Select Inside to use the region inside the polygon boundary or boundaries to calculate statistics. Select Outside to use the region outside the polygon boundary or boundaries. Select Mixed to use the blanking flag or BLN_Flag attribute values from the file or layer. The Mixed option is only available when the layer or file contains both blanking flags or BLN_Flag attributes: assign NoData inside (1) and assign NoData outside (0). If all blanking flags or BLN_Flag attributes are the same, the Inside or Outside option is selected automatically, and the Mixed option is not available.
Selected Objects Only
Select the Selected objects only option to use only the selected objects in the base layer to calculate statistics. When the Selected objects only box is checked, the Loaded polygons and vertices values are updated. Select a base layer in the Polygon Boundary field to use the Selected objects only option. The Selected objects only option is not available when the Polygon Boundary is a vector file. The polygon or polygons must be selected before clicking the Grids | Info | Grid Info command.
Combine All Polygons
Combine all polygons is checked by default and the statistics will be calculated for the total of all the polygons. When Combine all polygons is unchecked, the report presents statistics for each polygon.