Watershed
The Home | New Map | Specialty | Watershed command or the  button can be used to create a watershed map from a grid file. The Home | Add to Map | Layer | Watershed or Map Tools | Add to Map | Layer | Watershed command adds a watershed map layer to the selected map.
A watershed is defined as the region draining into a stream, stream system, or body of water. A watershed map reads the data from a grid file and splits the grid up into basin, or catchment, areas. Basin areas are areas that drain water to the stream. Stream paths are calculated based on the amount of flow into the grid node from all surrounding grid nodes. This shows the path water will take across the grid. Stream lines mark the low points on the map. Depressions are areas of internal drainage, such as a sink. Depressions can be forced to overfill so that water continues to move across the surface. Depression areas can be exported. Pour points are the outlets of the stream systems and are calculated at all drainage intersections and where the drainage leaves the edge of the grid. The pour points can be generated automatically or selected from a file. Surfer uses the eight-direction pour point algorithm to calculate the flow direction at each grid node. Custom methods are used to calculate the flow direction through flat areas and for filling depressions.
|
|
|
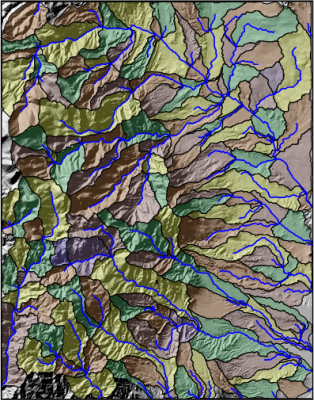
This example map shows a watershed with several basins and streams. A relief layer is overlaid. |
Creating a Watershed
To create a watershed:
- Click the Home | New Map | Specialty | Watershed command.
- Select a grid file in the Open Grid dialog and click Open.
-
If the selected file is in a format that supports 3D grids (e.g. VTK, HDF) the Data Type dialog will be displayed.
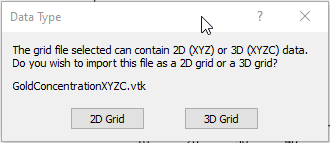
Click 2D Grid to import XYZ data or click 3D Grid to import an XYZC lattice with slice controls. If 2D grid is selected for a 3D grid file, the bottom slice (lowest Z value) will be imported.
The map is automatically created with reasonable defaults.
Editing an Existing Watershed
To change the features of the watershed map layer, click once on the watershed map layer in the plot window or in the Contents window to select it. The properties are displayed in the Properties window.
|
|
|
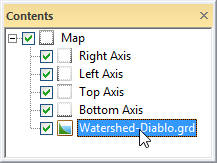
Click on the Watershed layer to select it. |
Adding a Map Layer
When watershed maps are created, they are independent of other maps in the plot window. For example, creating a watershed map while a contour map is present in the plot window yields two separate maps, each with its own set of axes and scaling parameters. To create a single map with the contour map on the watershed map, select both maps by clicking the Home | Selection | Select All command. Overlay the maps using the Overlay Maps command.
Alternatively, you can add the contour map directly to the existing watershed map by creating the contour map using the Home | Add to Map | Layer | Contour command. This automatically adds the contour map to the existing watershed map axes.
Another alternative, is to create both maps using the Home | New Map commands. Then, select one map and drag the map layer to the other map object. This is equivalent to using the Overlay Maps command to overlay maps. For example, create a contour map with the Home | New Map | Contour command. Create the watershed map using the Home | New Map | Specialty | Watershed command. This creates two separate maps. Click on the contour layer, hold down the left mouse button, and drag the contour map into the watershed map. A single map with two map layers, using one set of axes and scaling parameters is created.
Any number of peaks and depressions maps can be combined with any other map layers.
Watershed Properties
The watershed properties contains the following pages:
Map Properties
The map properties contains the following pages:
Watershed References
Many of the parameters for the watershed map are technical in origin, and a detailed development is beyond the scope of this document. For additional information, see the following resources:
O'Callaghan JF, Mark DM. (1984) "The Extraction of Drainage Networks from Digital Elevation Data.” Computer vision, Graphics and Image Processing, Vol. 28, 323-344.
Wang, L. & H. Liu (2006) “An Efficient Method for Identifying and Filling Surface Depressions in Digital Elevation Models for Hydrologic Analysis and Modelling.” International Journal of Geographical Information Science, Vol. 20, No. 2: 193-213.
Garbrecht, J. and Martz, L.W. (1997) “The assignment of drainage direction over flat surfaces in raster digital elevation models.” Journal of Hydrology, Vol. 193, 204-213.
Welsh, D. J. A.; Powell, M. B. (1967), "An upper bound for the chromatic number of a graph and its application to timetabling problems." The Computer Journal, Vol. 10 (1): 85–86.
Jenson S. K. and J. O. Domingue. 1988. "Extracting Topographic Structure from Digital Elevation Data for Geographic Information System Analysis." Photogrammetric Engineering and Remote Sensing, Vol. 54 (11): 1593-1600.
Pierre Soille, Jurgen Vogt, and Roberto Colombo, 2003, "Carving and adaptive drainage enforcement of grid digital elevation models." Water Resources Research, Vol. 39, NO. 12, 1366.