Color Scale Bar Labels Properties
The color scale bar Labels page controls the label properties for the color scale bar labels in the 2D view. The label properties are different for discrete (contour and wireframe) and continuous (color relief, surface, vector, and point cloud) color scale bars. Discrete color scale bars are labeled by specifying which levels include a label. Continuous color scale bars are labeled at a specific interval within the specified range.
|
|
|
|
Discrete color scale bar labels are displayed by frequency. |
Continuous color scale labels are displayed by interval |
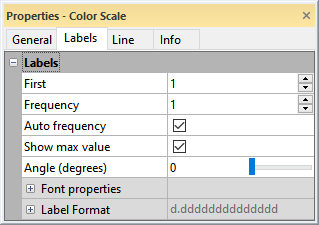
Discrete Color Scale Bar Labels
The Labels section for contour and wireframe color scale bars includes the label frequency options, angle, font properties, and format properties.
First Label
Set the first label value in the First box. A one here means to set the first line in the color scale bar with a label. To change the value, highlight the existing value and type a new value. Press ENTER on the keyboard to make the change. Alternatively, click the ![]() buttons to increase or decrease the values.
buttons to increase or decrease the values.
Label Frequency
Define the frequency of labels in the Frequency box. One draws every label, two draws every other label, etc. To change the value, highlight the existing value and type a new value. Press ENTER on the keyboard to make the change. Alternatively, click the ![]() buttons to increase or decrease the values.
buttons to increase or decrease the values.
Automatic Frequency
Check the box next to Auto frequency to allow Surfer to automatically determine a reasonable frequency for labels on the contour scale. The Auto frequency sets the label frequency so labels do not overlap. If there are too many labels to fit into the space next to the color scale bar, some labels are dropped to make the labels legible.
Show Maximum Value
Select the Show max value option to display a label at the top of the color scale bar. Which value is displayed depends on the level method:
- Simple - displays the value that is the lowest multiple of the contour interval plus the last contour level that is greater than the data maximum.
- Logarithmic - displays a value that is the lowest multiple of the logarithmic contour interval plus the last contour level that is greater than the data maximum.
- Equal-area - displays the maximum data value.
- Advanced - displays the maximum data value when the data maximum is greater than the last contour level or displays the last contour level plus the last contour interval when the data maximum is less than the last contour level.
Label Angle
Choose the angle at which the labels are drawn in the Angle (degrees) box. Positive values rotate the labels counterclockwise. To change the Angle (degrees), highlight the existing value and type in a new value. Or, drag the  to change the rotation. The labels automatically rotate to the new position.
Label Font
Click the ![]() next to Font Properties to set the label text properties.
next to Font Properties to set the label text properties.
Label Format
Click the ![]() next to Label Format to choose the numeric label format.
next to Label Format to choose the numeric label format.
When the Type is set to Date/time, if Invalid date text is displayed instead of the actual date/time format, the value for the label is outside the defined date/time range.
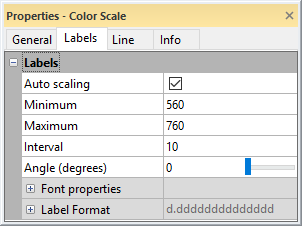
Continuous Color Scale Bar Labels
The Labels section for color relief, surface, vector, and point cloud color scale bars includes the label range and interval options, angle, font properties, and format properties.
Automatic Scaling
The Auto Scaling check box sets the label frequency so labels do not overlap. If there are too many labels to fit into the space next to the color scale bar, some labels are dropped to make the labels legible. When the Auto Scaling is not checked, set the Minimum, Maximum, and Interval values.
Minimum LabelSet the first label value in the Minimum box. The Minimum value is always labeled. This is a Z value in Z coordinates. To change the Maximum label, highlight the existing value and type a new value. When the color scale is displaying a logarithmic scale, the Maximum value must be greater than 0. Maximum LabelSet the last label value in the Maximum box. This is the last possible value that will be labeled. This may not be actually labeled, depending on the starting Minimum value and the Interval specified. This is a Z value in Z coordinates. To change the Minimum label, highlight the existing value and type a new value. When the color scale is displaying a logarithmic scale, the Minimum value must be greater than 0. Label IntervalThe Interval option is the actual Z interval between ticks and labels on the color scale bar. This is in Z coordinates. To change the Interval, highlight the existing value and type a new value. This option is only available for linear scaled color scale bars. Labels per DecadeThe Labels per decade option is the number of labels between major decade label marks. Available options are 1; 1,3; 1,5; 1,2,5; 1,2,3,5; 1,2,4,6,8; and All. All displays labels at 1, 2, 3, 4, 5, 6, 7, 8, and 9. To change the Labels per decade, click on the existing option and select the desired option from the list. This option is only available for logarithmic scaled color scale bars. Label AngleChoose the angle at which the labels are drawn in the Angle (degrees) box. Positive values rotate the labels counterclockwise. To change the Angle (degrees), highlight the existing value and type in a new value. Or, drag the |
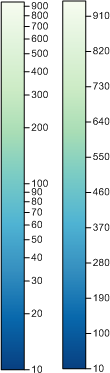
The color scale on the left uses logarithmic scaling. The color scale on the right uses linear scaling. Any colormap can be used for linear or logarithmic scaled intervals. |
Label Font
Click the ![]() next to Font Properties to set the label text properties.
next to Font Properties to set the label text properties.
Label Format
Click the ![]() next to Label Format to choose the numeric label format.
next to Label Format to choose the numeric label format.
When the Type is set to Date/time, if Invalid date text is displayed instead of the actual date/time format, the value for the label is outside the defined date/time range.
See Also
Color Scale Bar - Contour and Wireframe
Color Scale Bar - Vector, Color Relief, Surface, and Point Cloud