Drillhole Properties
A drillhole layer's properties can be modified in properties pages. Properties can also be modified for an individual drillhole (see Individual Drillhole Properties) and for the 3D view (see 3D Drillhole Properties). To define drillhole layer properties, click on the drillhole layer in the Contents window.
This help topic contains three main sections:
Individual Drillhole Properties
General Page
The General page of the Properties window contains the properties for viewing, reloading, and filtering drillhole data.
|
|
|
Drillhole layer General Properties |
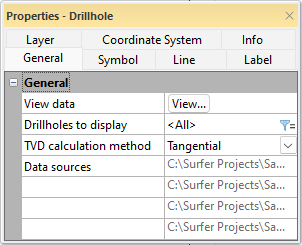
View Data
Select the View button to open the Drillhole Manager that allows you to manage imported drillhole data. See the Drillhole Manager help topic for more information.
Drillholes to Display
Use the Drillholes to display property to filter the drillhole data. If a filter was defined during the initial data import, that filter condition will be listed in the Drillholes to display property in the General page. If no filter was defined, All will be listed in the Drillholes to display property.
This filter is an inclusion filter to define the drillholes you want to display on the map. To create or edit a drillhole filter:
-
Click the
 button to the right of the Drillholes to display property. The Filter Drillholes dialog will appear.
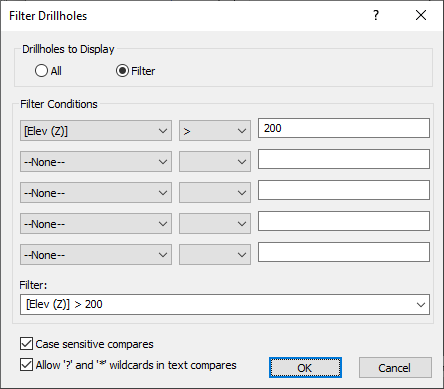
Example Filter Drillholes dialog
- Under Drillholes to Display, click the Filter option to filter the imported drillhole data. Use the five Filter Conditions rows to build the Filter using fields in the collars table or type the filter directly into the Filter box. Click a filter row to select a previously used query.
- The Case sensitive compares and Allow ? and * wildcard in text compares options control how text is compared in the filter query.
- When the Case sensitive compares check box is checked, the text returned by the filter conditions must have the same case.
- When the Allow ? and * wildcard in text compares check box is checked, a ? can be used to represent any single character and an * can be used to represent a group of characters.
- After defining a filter, click the OK button to refresh the drillhole layer with only the drillholes that match the filter conditions.
True Vertical Depth (TVD) Calculation Method
The measured depth, azimuth, and inclination data can be used to calculate the true vertical depth and XYZ coordinates along the drillhole path. Select the Tangential, Balanced Tangential, Minimum Curvature, Radius of Curvature, or Average Tangential method.
The TVD calculation method affects the coordinates and path of the drillhole in the following ways:
- the deviation path in the 2D plot view
- the coordinates displayed in the Coordinates page of the Properties window
- the 3D drillhole paths in the 3D view
Data Sources
The Data sources property lists the data files that have been imported. You can also view the imported file list in the Drillhole Manager.
Symbol Page
The Symbol page for a drillhole layer has two sections: Hole Top Symbol and Hole Bottom Symbol. Hole Top Symbol defines the symbol properties for the location of the top of each drillhole, and Hole Bottom Symbol defines the symbol properties for the location at the bottom of each drillhole. If the drillhole is vertical, the location of the top of the hole and bottom of the hole will be at the same XY position, but they will have a different Z position. If inclination and azimuth data were imported, then the X, Y and Z positions are different.
Hole Top Symbol
The Hole Top Symbol defines the symbol properties for the top of the drillhole, using the East (X) and North (Y) location values imported into the collars table. The symbol properties can define a fixed symbol or different symbols using collars data.
|
|
|
Example drillholes symbols properties |
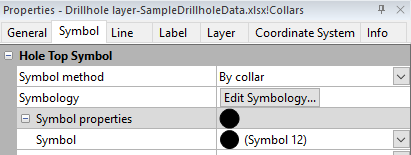
Symbol Method
To define fixed symbols so that all symbols are the same, select Fixed from the Symbol method list. See Symbol Properties for more information on setting common symbol properties. To define symbols that are specific to selected collars data, select by By collar from the Symbol method list, and then click the Edit Symbology button. The Drillhole Symbols dialog will appear.
Drillhole Symbology
The Drillhole Symbols dialog has two main sections: the section on the left displays the values of specific collars data to which the symbols will be applied, and the section on the right contains the properties that define those symbols.
|
|
|
Example Drillhole Symbols dialog |
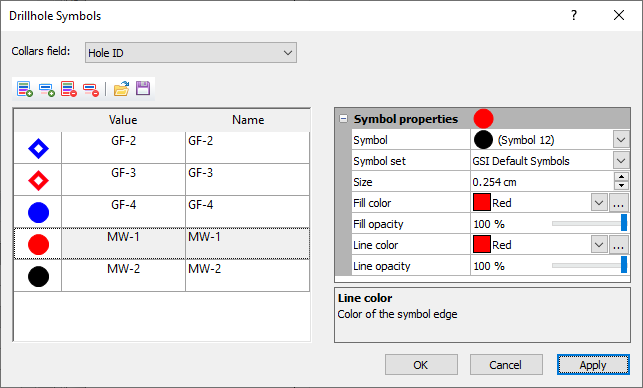
Follow these steps to create drillhole symbols.
- To use an existing drillhole symbols definition, click the
 button, locate a saved drillhole symbols file, and click Open.
 - To define a new set of drillhole symbols:
- Select a value from the Collars field list to use as the hole top symbol and then use one of the buttons below to select specific collars values.
- Click the
 button to add all values from the selected collars data.
 - Click the
 button to display a pick list of collars data.
 - Click the
 button to remove all collars data that were added to the collars values.
 - Click one or more values from the collars values and click the
 button to remove the selected rows.
 - After the collars values are set, click one or more of the collar data values and use the Symbols properties section to define the symbols for those values. See Symbol Properties for more information on setting common symbol properties. After defining one or more symbols, you can click the Apply button to view the changes on the map.
- After defining symbols for all collar data values, click the
 button to save the symbol definition to a file.
 - After saving changes to a file, click the OK button to close the dialog.
Hole Bottom Symbol
Check the Show symbol check box in the Hole Bottom Symbol section to display a symbol at the XY location of the bottom of each drillhole. See Symbol Properties for more information on setting common symbol properties.
Line Page
Check the Show deviation path check box to show the drillhole path defined in the survey data. If you did not import survey data, but you did import azimuth/inclination collars data, the path will be a straight line. See Line Properties for information on setting the other line properties.
Label Page
Use the Label Sets properties to label the drillholes on the map using any field in the collars data. You can label the drillholes using one or multiple collars fields by creating one or multiple label sets. For information on common label properties, such as Font and Label Format, see the Label Properties help topic.
|
|
|
Example Label page properties |
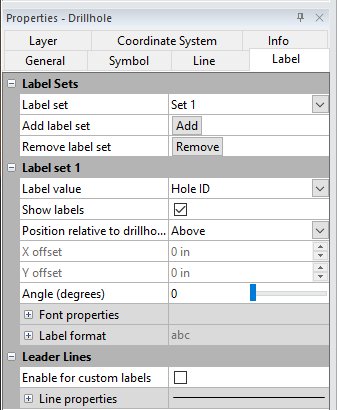
Label Sets
The Label Sets section controls which label is being controlled by the Label Set # section. Multiple labels can be displayed by changing the Label Sets settings. Click the ![]() next to Label Sets to open the Label Sets section.
next to Label Sets to open the Label Sets section.
Note: If only one label needs to be customized (e.g., moved to a different position), click on the specific drillhole in the Contents window. See the Individual Drillhole Label Page section below for more information.
Label Set
The Label set displays the name of the label that is currently being changed. Click on the set name (Set 1, for instance) to select a different set name from the list. If only Set 1 is displayed in the list, only a single label set is currently created. All of the Label Set # properties apply to only the selected Label set.
Add Label Set
The Add label set option allows new labels to be added. Click the Add button to create a new Label set. The Label set option automatically changes to the new set. If this is the second label to be added, a Set 2 is added to the Label set list. If this is the third label to be added, a Set 3 is added to the Label set list, and so on.
Remove Label Set
The Remove label set option deletes a label from the Label set list. To delete a label, first set the Label set to the label that should be deleted. Then, click the Remove button next to Remove label set to delete the label. All properties of the label set are removed.
Label Set #
The Label Set # section controls the worksheet column, position, angle, font, and label properties for the selected Label set . Before making any changes in this section, change the Label set option to the desired label. The Label Set # changes to display the name of the Label set . For instance, if Label set is set to Set 3 , the Label Set # section name changes to Label Set 3.
Label Value
From the Label Value list, select the collars column containing the values or text you wish the Label set to display near the drillholes. Labels may be the original data values for the drillholes, or may be other identifying text such as well names or sample numbers.
Position Relative to Drillhole Start
The Position relative to drillhole start controls the offset of the selected label from the symbol center. To change the position, first change the Label set to the desired label. Then, click on the existing position in the Position relative to drillhole start option and select the new position from the list. Available options are Center, Left, Right, Above, Below, and User defined. User defined allows you to specify the exact offset (in page units) in the X offset and Y offset boxes. The labels are all placed in the same position relative to the associated symbol.
Positive offset values move the labels in the positive axis direction. For reversed axes, this means that the label is moved in the opposite direction of the Position relative to symbol specified. For instance, if the bottom axis is reversed, setting the Position relative to symbol to Left will move the label to the right of the symbol (in the negative direction). Setting the Position relative to symbol to User defined and setting the X offset to 0.25 inches will move the label 0.25 inches in the negative axis direction.
X Offset and Y Offset
When the Position relative to symbol option is set to User defined, the X offset and Y offset options are available. The X offset controls the location of the label in the left-right direction. Positive values in the X offset shift the label position toward the positive direction (to the right of the symbol for normal axes, to the left for reversed axes). Negative values in the X offset shift the label position toward the negative direction (to the left of the symbol for normal axes, to the right for reversed axes). A value of zero places the label directly in the center of the symbol.
The Y offset controls the placement of the label in the up-down direction. Positive values in the Y offset shift the label position toward the positive direction (upward for normal axes, downward for reversed axes). Negative values in the Y offset shift the label position toward the negative direction (downward for normal axes, upward for reversed axes). A value of zero places the label directly in the center of the symbol. The X offset and Y offset values are numbers between -4 and +4 inches (-10.16 and +10.16 centimeters).
Angle (degrees)
The Angle (degrees) box specifies the angle in degrees to rotate the selected label set. Positive angles rotate the labels counterclockwise. To change the Angle (degrees), highlight the existing angle value. Type a new value or click and drag the  to the desired angle position.
Font
Click the ![]() next to Font Properties to display the Font Properties section. The font properties are applied to all labels in this label set. Different label sets can contain different font properties.
next to Font Properties to display the Font Properties section. The font properties are applied to all labels in this label set. Different label sets can contain different font properties.
Format
Click the ![]() next to Label Format to display the Label Format section. The numeric format is applied to all numbers read from the specified label column in this label set. Different label sets can contain different label formatting.
next to Label Format to display the Label Format section. The numeric format is applied to all numbers read from the specified label column in this label set. Different label sets can contain different label formatting.
When the Type is set to Date/time, if Invalid date text is displayed instead of the actual date/time format, the value for the label is outside the defined date/time range.
Leader Lines
The Leader Lines section is used when the drillhole layer has labels that are moved to a new location. The leader line is drawn from the symbol center to the new label location.
Enable for Custom Labels
Check the Enable for custom labels option to display leader lines when labels are moved to a new location with the Disperse Labels command. The leader line will display a line from the original label location to the dispersed location.
Leader Line Properties
Click the ![]() next to Line Properties to display the Line Properties options. This allows you to specify the line Style, Color, Opacity, and Width for leader lines.
next to Line Properties to display the Line Properties options. This allows you to specify the line Style, Color, Opacity, and Width for leader lines.
Layer Page
Use the Opacity slider to define the opacity of the drillholes.
Coordinate System Page
See Assign Coordinate System for coordinate system information.
Info Page
See Info Properties for general information on Info pages and on how to define attributes.
Individual Drillhole Properties
In the Contents window, expand a drillhole layer to show each of its drillholes. Check or uncheck the check box next to one of the drillholes to show or not show that drillhole. Select one of the drillholes to define its properties. Individual drillholes have five Properties pages.
Note: Some of the check boxes in the individual drillhole property pages have three settings instead of just checked and unchecked.
- A filled check box means that the individual drillhole object property always matches the drillhole layer property. Changes made to the drillhole layer property are applied to each individual drillhole.
- Checked and unchecked check boxes mean that the property settings for an individual drillhole are applied and override any setting in the drillhole layer properties.
Individual Drillhole Symbol Page
The individual drillhole Symbol page for hole top and hole bottom symbols is similar to the drillhole layer symbol properties. The individual Symbol page has an Override layer check box for the hole top symbol and the hole bottom symbol. When checked, this box overrides the drillhole layer symbol properties. If an Override layer box is not checked, then only the drillhole layer symbol properties are displayed. The Show symbol check box in the Hole Bottom Symbol section has three settings: a filled check box uses the drillhole layer properties; checked shows the symbol and overrides the drillhole layer properties; and unchecked does not show the symbol and overrides the drillhole layer properties.
Individual Drillhole Line Page
The individual drillhole Line page is similar to the drillhole layer line properties. The individual Line page has an Override layer check box that overrides the drillhole layer line properties. If this box is not checked, then only the drillhole layer line properties are displayed. The Show deviation path check box has three settings: a filled check box uses the drillhole layer properties; checked shows the deviation path and overrides the drillhole layer properties; and unchecked does not show the path and overrides the drillhole layer properties.
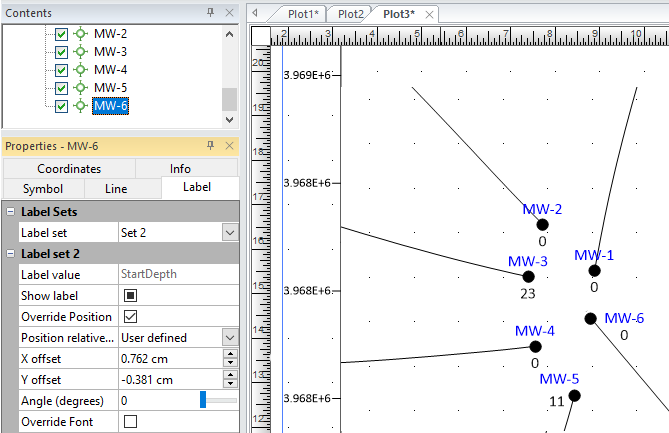
Individual Drillhole Label Page
Label sets are added in the drillhole layer properties and cannot be added or changed for individual drillholes. The label position, font and format for an individual drillhole can be changed. The individual drillholes Label page has three check boxes (Override Position, Override Font, and Override Format) that override the drillhole layer label properties. A filled check box uses the drillhole layer properties; checked applies the property to the individual drillhole and overrides the drillhole layer properties; and unchecked does not apply the property and overrides the drillhole layer properties.
See the Label Sets section above for more information on label sets and the shared drillhole layer and individual drillhole label properties. See the Font Properties and Label Format help topics for information on common label properties.
Example Individual Drillhole Labels
The following image is an example of two label sets. Set 1 and Set 2 create labels from drillhole collar data: Hole ID (in blue) and StartDepth (in black). The individual drillhole, "MW-6", is shown with its Override Position box checked, so a User defined Position relative to drillhole start property could be applied to change the Set 2 StartDepth X offset value to move the label to a more readable position.
|
|
|
Example drillhole labeling with two collars data fields |
Individual Drillhole Coordinates Page
This page shows the X, Y and TVD (True Vertical Depth) coordinates for the specific drillhole. The X and Y values are from the collars data. The TVD is calculated from the azimuth and inclination data (either in a collars or survey data), along with either the start and end depths (collars data) or the measured depth data (survey data ). If there is no depth data, then Surfer uses the depth data available in the points or interval data.
Note: When drillholes are deviated, the true vertical depth can be calculated by Surfer. Several calculation methods exist, and each method creates a mathematical approximation of the true X, Y, and Z value along the drillhole path. Surfer uses the tangential method for calculating true vertical depth from measured depth. This method is probably the simplest method for computing true vertical depth. It uses only the inclination and direction measured at the lower end of the borehole or drillhole. The drillhole path is assumed to be a straight line throughout the course. This method has historically been used more than any other, but can be the least accurate. Drillholes calculated with the tangential method can appear too shallow and the lateral displacement along the drillhole can be too large. The error is minimized if short intervals are used between points.
Individual Drillhole Info Page
This page contains information about the selected drillhole that can also be copied to the clipboard. All the fields from the collars data are displayed here with the values for the selected drillhole. If needed, an attribute can be created.
Legend Properties
If the drillhole layer Symbol property for Symbol method in the Hole Top Symbol section is set to By collar, you can add a legend to a drillhole layer. Click the Map Tools | Add to Map | Legend command to add a legend and then click the Legend object in the Contents window to display legend properties. Most of these properties, such as the General and Info properties, are similar to legends in other maps (see the Legend help topic).
|
|
|
Example drillhole Legend Layers Page properties |
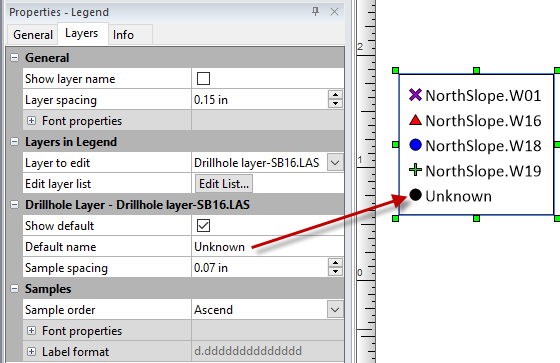
Drillhole Layers Legend Properties
The Drillhole Layer section of the Layers page is unique to drillholes. You have full control over what is displayed in the legend using the Template field. This field uses special directives to pull information from your data. You can also control the Symbol sizing method and the Line sample size to match the plot or a fixed size, and adjust the Sample spacing. See the Drillhole section of the template page for more detailed information.