Contour Volume and Area
The Grids | Calculate | Contour Vol/Area command computes the volume and area above, below, and between specific contour lines from a grid file or grid-based map type.
You do not need an active contour map in your plot window to run this command; Surfer calculates these values directly from the underlying grid data arrays. A minimum of two contour lines must be defined within the parameters to populate results; otherwise, the output fields will register as n/a. The calculation results are output directly to the standalone Grid Contour Vol/Area Report.
Units of Measurement
Units of measurement in the generated report are strictly dictated by the native spatial units of the input grid file. Calculated areas are reported in square units (e.g., m2 or ft2), while volumes are reported in cubic units (e.g., m3 or ft3).
Golden Nugget : Results are based strictly on the units of the input grid file. If your grid uses geographic coordinate systems (Latitude/Longitude), the horizontal area will be reported in invalid Lat x Lon units. For accurate and meaningful measurements, ensure your input grid is projected into a linear unit system like feet or meters before running this command.
Calculating Volumes and Areas
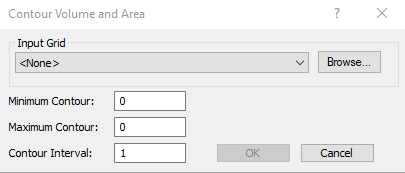
Click the Grids | Calculate | Contour Vol/Area command to open the setup interface:
|
| Specify the minimum and maximum contour lines and contour interval for the sampled contour lines in the Contour Volume and Area dialog. |
Input Grid
Specify the source map layer or grid file in the Input Grid field. Only map layers created from underlying grid files are included in this selection list. Map layers will be displayed from all open plot documents. Click Browse to load an unmapped grid file directly using the Open Grid dialog. If you highlight an existing contour map layer prior to opening the dialog, the defaults for Minimum, Maximum, and Interval will automatically match that layer's properties.
Minimum Contour
Set the Minimum contour to the precise value of the first contour line to be included in the volumetric integration. To change this setting, highlight the existing value, type the new numeric limit, and press ENTER on your keyboard.
Maximum Contour
Set the Maximum contour to the precise value of the final contour line you want included in the calculation sequence. To change this setting, highlight the existing value, type the new numeric limit, and press ENTER on your keyboard.
Contour Interval
The contour interval defines the uniform difference in vertical elevation between two consecutive calculation slices. The calculation will be processed meticulously at every matching interval step between your specified Minimum Contour and Maximum Contour limits.
Note: The Simple level method is always programmatically used for this calculation, regardless of the level method assigned within the plot document property fields.
See Also
Introduction to Volumes, Areas, Cross Sections
Calculating the Volume of a Grid with NoData values