3D Surface Group General Properties
To edit a 3D surface map, click once on the surface map to select it. The properties for the surface map are displayed in the Properties window.
|
|
|
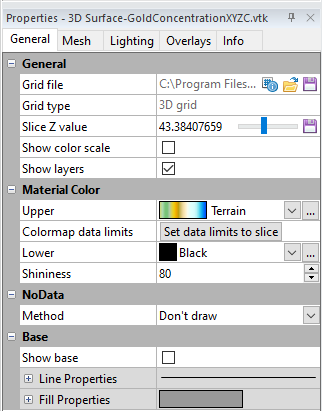
Change 3D surface map properties in the Properties window on the General page. |
General
Input Grid File
The Grid file displays the path and file name for the grid file used for the map. If the entire file name is not shown, place the mouse over the file name. A small window will appear with the full path and name displayed.
Grid Information
The ![]() button displays information about the grid file used to produce the map layer. The information includes the grid size, the minimum and maximum X, Y, Z, and C values contained in the grid file, and statistics. If the grid file contains more than 40 million nodes, you are asked if you wish to create a detailed report or a quick report. Click Yes in the message to create a detailed grid report, or click No to create a shorter quick grid report.
button displays information about the grid file used to produce the map layer. The information includes the grid size, the minimum and maximum X, Y, Z, and C values contained in the grid file, and statistics. If the grid file contains more than 40 million nodes, you are asked if you wish to create a detailed report or a quick report. Click Yes in the message to create a detailed grid report, or click No to create a shorter quick grid report.
Change File
The ![]() button displays the Open Grid dialog. This allows you to select a new grid file, or an updated version of the grid file used to create the contour map. Select a grid file and click Open. If the Z range for the new grid is outside the old contour levels, you will be prompted to continue the operation. If you clickCancel, the grid file is not replaced. If you clickOK, the grid file is replaced, but no contour lines are drawn. You can update the contour levels being displayed on theLevelstab.
button displays the Open Grid dialog. This allows you to select a new grid file, or an updated version of the grid file used to create the contour map. Select a grid file and click Open. If the Z range for the new grid is outside the old contour levels, you will be prompted to continue the operation. If you clickCancel, the grid file is not replaced. If you clickOK, the grid file is replaced, but no contour lines are drawn. You can update the contour levels being displayed on theLevelstab.
If the new grid exceeds the current map limits, another warning will appear asking you to adjust the map limits. If you click Yes, the limits are automatically adjusted to fit the new grid. If you click No, the limits are not automatically adjusted. The map may not be displayed. To change the map limits, click on the Map object in the Contents window and the Limits tab in the Properties window.
You may also see a warning message that the current map scale may result in an un-viewable map. Clicking OK allows the map scale to automatically be adjusted.
Coordinate System Note:
Regardless of the file selected with either the Map Tools | Reload | Map Data command or by clicking the ![]() button in the Properties window, the coordinate system for the original map layer is used after updating the file. If this is not the correct coordinate system, click on the map layer to select it. In the Properties window, click on the Coordinate System tab and set the coordinate system to the appropriate new system.
button in the Properties window, the coordinate system for the original map layer is used after updating the file. If this is not the correct coordinate system, click on the map layer to select it. In the Properties window, click on the Coordinate System tab and set the coordinate system to the appropriate new system.
Save File
The  button displays the Save Grid As dialog. Type a File name and change the Save as type to the desired grid file format. Click Save. If a coordinate system has been defined on the Coordinate System tab in the Properties window, an Export Options dialog appears. Check the desired file formats. It is recommend that GS Reference (Version 2) file option be checked to generate a .GSR2 file. Click OK and the file is saved.
If the map layer was created using a 3D grid, only 3D grid file formats (HDF, VTK, etc.) will be available in the Save as type field.
Grid Type
The Grid type field tells the user whether a 2D grid or 3D grid was used to create the map layer. This field is informational only.
Slice Z Value
The Slice Z value defines which horizontal slice of a 3D grid file is mapped. Click on the current value and enter a specific number to view the results for a that horizontal slice. Click and drag the slider to see the mapped results change as the slice value changes.
By default, Surfer will select a Z value near the middle of the range as the Slice Z value.
Save Slice
The Save Slice command saves the current horizontal slice of a 3D grid as a 3D grid file.
Click the button to display the Save Grid As dialog. Type a File name and change the Save as type to the desired grid file format. Click Save. If a coordinate system has been defined on the Coordinate System tab in the Properties window, an Export Options dialog appears. Check the desired file formats. It is recommend that GS Reference (Version 2) file option be checked to generate a .GSR2 file. Click OK and the file is saved.
Show Color Scale
The Show color scale option permits the display of a color scale bar adjacent to the map. The color scale bar indicates the colors assigned to the grid values on the map, and the associated values are displayed as labels on the color scale bar. When the Show color scale box is checked, the color scale bar is displayed. If the colormap is set to a logarithmic scale, the color scale bar will automatically display logarithmic scaling.
Layers
Check the Show layers box to show the overlay layers on the surface. For example, add a post map layer to a surface. Check the Show layers box to make the post map visible. Multiple layers can be combined into a single composite map, and this allows the overlays to be displayed on an individual basis. The appearance of the overlay layers is controlled on the Overlays page.
Material Color
The Material Color section shows the spectrum of colors used to color the upper and lower sides of the surface. The light angle and colors also affect the appearance of the surfaces.
Upper
The Upper color controls the main color spectrum of the surface map. To change the upper surface colors, click on the color next to Upper. Select any new colormap from the list. If the desired colormap is not displayed, click the ![]() button next to the selected colormap. The Colormap Editor opens, allowing you to specify additional color options. To set the colormap to use a logarithmic scale, click the
button next to the selected colormap. The Colormap Editor opens, allowing you to specify additional color options. To set the colormap to use a logarithmic scale, click the ![]() button to the right of the selected colormap. Check the Logarithmic scaling option and click OK. The color map is automatically updated to show logarithmic scaling.
button to the right of the selected colormap. Check the Logarithmic scaling option and click OK. The color map is automatically updated to show logarithmic scaling.
When overlaying map layers on a surface, especially image base layers, the layers will be brighter if you change the Upper material color to a completely white colormap:
- Click the
 button next to Upper.
 - In the Colormap Editor, change the Presets to Grayscale.
- Click the lower limit (left) anchor node.
- Change the Color to white.
- Click OK in the Colormap Editor.
Colormap data limits
By default, the data limits for a 3D surface map created using a 3D grid are set to the C limits of the entire grid. The Set data limits to slice option sets the data limits for the colormap to match the data limits of the current Z slice being contoured. When the Z slice is changed, the colormap data limits remain the same until the Set data limits option is clicked again. If the colormap data limits are not reset, colors will be applied based on the previously defined range.
To return the colormap data limits to the C limits of the entire grid, click undo or note the C min and C max values on the Info page and then enter those values in the Min and Max fields in the Colormap Editor.
The Reset colormap field is visible only if the contour map was created using a 3D grid.
Lower
The Lower button controls the single color of the bottom of the surface. Unless the bottom of the surface is at a sufficient angle to the light source, there will be insufficient reflection to see it. Also, as you increase the ambient light (colors closer to white) the lower surface color becomes more visible because ambient light is everywhere and directionless. To change the Lower surface color, click on the current color next to Lower. Click on the new color in the list. To use a custom color or set additional color options, click the ![]() button next to the selected color. The Colors dialog opens, allowing you to set additional options.
button next to the selected color. The Colors dialog opens, allowing you to set additional options.
Shininess
Shininess controls the size of the specular reflections. As the shininess percentage increases, the reflections become more focused. Select a value between 0 and 100. To change the value, highlight the existing Shininess percentage value and type a new value or use the up and down arrow buttons to scroll to a new value.
NoData
The NoData section defines how nodes assigned the NoData value are handled in the surface map. Set the Method to Don't draw or Remap to.
- If Don't draw is selected, the NoData areas are not drawn on the map and appear as small transparent gaps in the surface.
- If Remap to is selected, type the new value into the Remap value option below. The Remap value is in Z or C coordinate units depending on the grid type. Make sure the new value is within the range of values in the current map. The default Remap value is the grid Z minimum for 2D grids and the C minimum for the current slice for 3D grids.
Base
Check the Show base box to fill the base with the look of a filled solid. The Show base option is useful when creating block diagrams. Control which base color is visible in the block diagram by arranging the 3D surface layers in the Contents window. The bottom-most layer in the map should be the bottom layer in the Contents window, and the top-most layer in the map should be the top layer in the Contents window.
Base Method
Select an option from the Base method property to fill the base down to a specific Z value.
- Map minimum fills the base down to the minimum Z value of all grids in the map.
- Grid minimum fills the base down to the minimum Z value of the grid used to create the selected layer.
- Custom fills the base down to the Z value that you specify in the Custom base value property. Click the Info tab to view minimum and maximum Z values.
Note that if a 3D grid was used to create a 3D surface, the C values of the slice are treated as Z values during this operation.
Base Line Properties
Click the  button to view the Line Properties for the base line. The line properties for the 3D surface map base line are different than line properties for other objects.
- Click the current line Style and select None or Solid to hide or display the base line.
- To change the base line color , click the current selection next to Color and select a new color from the color palette. Alternatively, click the button and select or create a color in the Colors dialog.
- Change the base line width by typing a value in page units into the Width field.
Base Fill Properties
Click the button to view the Fill Properties for the base line. The fill properties for the 3D surface map base fill are different than fill properties for other objects.
- Click the current fill Style and select None, Solid, or Lit to change the fill style for the 3D surface base. Solid shows the base with a uniform fill, and the fill is not affected by the 3D surface lighting. Lit applies the 3D surface lighting to the base.
- To change the base fill color , click the current selection next to Color and select a new color from the color palette. Alternatively, click the button and select or create a color in the Colors dialog.