Color Relief Layer General Properties
To edit a color relief layer, click once on the color relief layer to select it. The properties for the color relief layer are displayed in the Properties window. The color relief properties General page contains the following options:
|
|
|
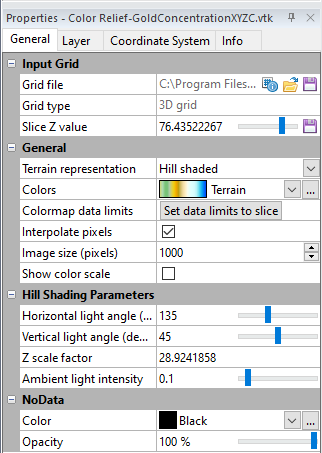
The color relief layer properties General page controls the layer color, color scale bar, hill shading, pixel interpolation, and missing data. |
General
Input Grid File
The Grid file displays the path and file name for the grid file used for the map. If the entire file name is not shown, place the mouse over the file name. A small window will appear with the full path and name displayed.
Grid Information
The ![]() button displays information about the grid file used to produce the map layer. The information includes the grid size, the minimum and maximum X, Y, Z, and C values contained in the grid file, and statistics. If the grid file contains more than 40 million nodes, you are asked if you wish to create a detailed report or a quick report. Click Yes in the message to create a detailed grid report, or click No to create a shorter quick grid report.
button displays information about the grid file used to produce the map layer. The information includes the grid size, the minimum and maximum X, Y, Z, and C values contained in the grid file, and statistics. If the grid file contains more than 40 million nodes, you are asked if you wish to create a detailed report or a quick report. Click Yes in the message to create a detailed grid report, or click No to create a shorter quick grid report.
Change File
The ![]() button displays the Open Grid dialog. This allows you to select a new grid file, or an updated version of the grid file used to create the contour map. Select a grid file and click Open. If the Z range for the new grid is outside the old contour levels, you will be prompted to continue the operation. If you clickCancel, the grid file is not replaced. If you clickOK, the grid file is replaced, but no contour lines are drawn. You can update the contour levels being displayed on theLevelstab.
button displays the Open Grid dialog. This allows you to select a new grid file, or an updated version of the grid file used to create the contour map. Select a grid file and click Open. If the Z range for the new grid is outside the old contour levels, you will be prompted to continue the operation. If you clickCancel, the grid file is not replaced. If you clickOK, the grid file is replaced, but no contour lines are drawn. You can update the contour levels being displayed on theLevelstab.
If the new grid exceeds the current map limits, another warning will appear asking you to adjust the map limits. If you click Yes, the limits are automatically adjusted to fit the new grid. If you click No, the limits are not automatically adjusted. The map may not be displayed. To change the map limits, click on the Map object in the Contents window and the Limits tab in the Properties window.
You may also see a warning message that the current map scale may result in an un-viewable map. Clicking OK allows the map scale to automatically be adjusted.
Coordinate System Note:
Regardless of the file selected with either the Map Tools | Reload | Map Data command or by clicking the ![]() button in the Properties window, the coordinate system for the original map layer is used after updating the file. If this is not the correct coordinate system, click on the map layer to select it. In the Properties window, click on the Coordinate System tab and set the coordinate system to the appropriate new system.
button in the Properties window, the coordinate system for the original map layer is used after updating the file. If this is not the correct coordinate system, click on the map layer to select it. In the Properties window, click on the Coordinate System tab and set the coordinate system to the appropriate new system.
Save File
The  button displays the Save Grid As dialog. Type a File name and change the Save as type to the desired grid file format. Click Save. If a coordinate system has been defined on the Coordinate System tab in the Properties window, an Export Options dialog appears. Check the desired file formats. It is recommend that GS Reference (Version 2) file option be checked to generate a .GSR2 file. Click OK and the file is saved.
If the map layer was created using a 3D grid, only 3D grid file formats (HDF, VTK, etc.) will be available in the Save as type field.
Grid Type
The Grid type field tells the user whether a 2D grid or 3D grid was used to create the map layer. This field is informational only.
Slice Z Value
The Slice Z value defines which horizontal slice of a 3D grid file is mapped. Click on the current value and enter a specific number to view the results for a that horizontal slice. Click and drag the slider to see the mapped results change as the slice value changes.
By default, Surfer will select a Z value near the middle of the range as the Slice Z value.
Save Slice
The Save Slice command saves the current horizontal slice of a 3D grid as a 3D grid file.
Click the button to display the Save Grid As dialog. Type a File name and change the Save as type to the desired grid file format. Click Save. If a coordinate system has been defined on the Coordinate System tab in the Properties window, an Export Options dialog appears. Check the desired file formats. It is recommend that GS Reference (Version 2) file option be checked to generate a .GSR2 file. Click OK and the file is saved.
Terrain Representation
The Terrain Representation property specifies if the color relief layer visualization is enhanced by hill shading or reflectance or if only colors are displayed. Select Color only to color the layer by the grid value and colormap only. Select Hill shaded to apply hill shading to the map. Select Reflectance to apply reflectance shading to the map.
Hill shading is a method of representing relief by depicting shadows cast by a point light source. Select the Hill shaded to apply hill shading to the color relief map. For hill shading a color relief map with a GrayScale colormap, it is recommended you change the lower color of the colormap to a slightly lighter black (e.g. 80% Black). The Hill Shading Parameters are displayed when the Hill shaded option is selected.
Reflectance uses colors to indicate the local orientation of the surface relative to a user-defined light source direction. Surfer determines the orientation of each grid cell and calculates reflectance of a point light source on the grid surface. The light source can be thought of as the sun shining on a topographic surface. Portions of the surface that face away from the light source reflects less light toward the viewer, and thus appear darker. The colors on a reflectance shaded color relief map are based on the reflectance from the grid surface. Reflectance values range from zero to one. A reflectance value of zero means that no light is reflected toward the viewer. A reflectance value of one means that all incident light is reflected toward the viewer. The Reflectance Parameters are displayed when the Reflectance option is selected.
Hill shading and Reflectance replaces the 3D View Lighting properties. To use the 3D view lighting properties when viewing the map in the 3D view, set the Terrain representation to Color only.
Hill and Reflectance Shading in the 3D View
The 3D view lighting is turned off when the map in the 3D view contains a hill shaded or reflectance shaded color relief layer. This is because the map is already shaded by hill shading or reflectance. The cumulative effect of both lighting systems would result in very dark regions of the map in the 3D view.
To use the 3D view Lighting properties instead of the color relief hill or reflectance shading, the Terrain representation option on the color relief layer General page must be set to Color only.
Colors
The Colors option defines the colormap used to fill the color relief map. The colormap can use a linear or logarithmic scale. Change the color by clicking the existing color bar next to Colors. Select the new colormap from the list. If the desired color map is not listed, click the ![]() button to the right of the selected colormap. The Colormap Editor appears. Make any changes and click OK to see the change on the map. To set the colormap to use a logarithmic scale, click the
button to the right of the selected colormap. The Colormap Editor appears. Make any changes and click OK to see the change on the map. To set the colormap to use a logarithmic scale, click the ![]() button to the right of the selected colormap. Check the Logarithmic scaling option and click OK. The color map is automatically updated to show logarithmic scaling.
button to the right of the selected colormap. Check the Logarithmic scaling option and click OK. The color map is automatically updated to show logarithmic scaling.
Colormap data limits
By default, the data limits for a color relief map created using a 3D grid are set to the C limits of the entire grid. The Set data limits to slice option sets the data limits for the colormap to match the data limits of the current Z slice being contoured. When the Z slice is changed, the colormap data limits remain the same until the Set data limits option is clicked again. If the colormap data limits are not reset, colors will be applied based on the previously defined range.
To return the colormap data limits to the C limits of the entire grid, click undo or note the C min and C max values on the Info page and then enter those values in the Min and Max fields in the Colormap Editor.
The Reset colormap field is visible only if the contour map was created using a 3D grid.
Interpolate Pixels
The Interpolate pixels check box activates color smoothing on the map. When checked, Interpolate pixels uses bilinear interpolation to calculate colors on the map. Bilinear interpolation makes the color gradations smoother, but it can slightly slow the on-screen drawing of the color relief map.
When a dense grid (a grid with relatively large numbers of rows and columns) is used, little difference is seen between the final color relief maps whether the Interpolate pixels option is checked or not. For dense grids, on-screen drawing time can be reduced when the Interpolate pixels option is unchecked.
When a coarse grid (a grid with relatively few rows and columns) is used and the Interpolate pixels option is not checked, all pixels within a single grid square are assigned the same color. This creates a grid-square map, and can result in a color relief map with a very blocky appearance. For coarse grids, therefore, a smoother appearance results when the Interpolate pixels check box is checked.
The non-interpolated color relief map maps each grid node to a pixel, i.e. a grid cell, which is expanded to a block of pixels to make the map the correct size. The interpolated color relief map assigns colors to the pixel or pixels at a grid node and then interpolates the colors for the pixels between the grid nodes.
Image Size (Pixels)
The Image size (pixels) property determines the number of pixels along the longest side of the color relief map. The number of pixels along the shorter side of the map is calculated from the Image size (pixels) and aspect ratio of the input grid file. The default Image size (pixels) value is 1000. Click the  buttons to increase or decrease the Image size (pixels) by 100.
Increase the Image size (pixels) value to smooth the appearance of the color relief layer. Decrease the Image size (pixels) value to speed up the color relief layer rendering time. The Image size (pixels) property can be any integer value between 2 and 32767. Use caution when increasing the Image size (pixels) value to very large numbers. Large values can significantly increase the time to render the color relief layer.
Show Color Scale
The Show color scale option permits the display of a color scale bar adjacent to the map. The color scale bar indicates the colors assigned to the grid values on the map, and the associated values are displayed as labels on the color scale bar. When the Show color scale box is checked, the color scale bar is displayed. If the colormap is set to a logarithmic scale, the color scale bar will automatically display logarithmic scaling.
Hill Shading Parameters
The Hill Shading Parameters are displayed when the Hill shaded option is selected.
Horizontal Light Angle
The Horizontal light angle (degrees) box defines the direction for the light source in the horizontal plane. Zero degrees corresponds to the light source shining from due east toward the west. Positive angles rotate the light source counterclockwise. For example, a specified horizontal angle of 90 degrees places the light source north of the unrotated surface. 180 degrees places the light source west of the unrotated surface and shining east. 270 degrees places the light source south of the unrotated surface and shining north. The default horizontal angle is set at 135 degrees, or NW. To change the Horizontal light angle (degrees), highlight the existing angle value. Type a new value or click and drag the  to the desired angle position. The Horizontal light angle (degrees) option is disabled when the Enable hill shading box is not checked.
Vertical Light Angle
The Vertical light angle (degrees) box rotates the light source in the vertical plane. A vertical angle of zero degrees places the light source at the horizon and shining horizontally. An angle of 90 degrees places the light source directly overhead and shining down onto the map. The default vertical angle is 45 degrees. As the vertical angle approaches zero, shadows lengthen. To change the Vertical light angle (degrees), highlight the existing angle value. Type a new value or click and drag the to the desired angle position. The Vertical light angle (degrees) option is disabled when the Enable hill shading box is not checked.
Z Scale Factor
The Z scale factor box allows you to specify the Z scale to use for the surface. As you increase the Z scale factor, the surface becomes more exaggerated vertically. Increasing the factor enhances the shading effect, and can be useful for bringing out more detail, especially on relatively flat surfaces. The default Z scale factor scales the Z coordinates to 1/4th the XY diagonal of the input grid. The Z scale factor option is disabled when the Enable hill shading box is not checked. The Z scale factor must be greater than 0. If a value less than or equal to 0 is entered into the Z scale factor box, the value will be automatically set to approximately 1.192 x 10⁻⁷.
For 3D grids, all of the above information is applicable to the C values for the selected Z slice and this field is renamed to C Scale Factor.
Ambient Light Intensity
The Ambient light intensity property controls the overall brightness of the surface. The Ambient light intensity is a value between 0 and 1. To change the Ambient light intensity, highlight the existing angle value. Type a new value or click and drag the to the desired angle position. The Ambient light intensity option is disabled when the Enable hill shading box is not checked.
Reflectance Parameters
The Reflectance Parameters are displayed when the Reflectance option is selected.
Reflectance Method
The Reflectance method specifies the algorithm used to compute the reflected light at each grid cell. The Reflectance method determines how the colors are distributed in relation to the slopes and slope directions (aspect) over the extent of the map.
Horizontal Light Angle
The Horizontal (degrees) box defines the direction for the light source in the horizontal plane. Zero degrees corresponds to the light source shining from due east toward the west. Positive angles rotate the light source counterclockwise. For example, a specified horizontal angle of 90 degrees places the light source north of the unrotated surface. 180 degrees places the light source west of the unrotated surface and shining east. 270 degrees places the light source south of the unrotated surface and shining north. The default horizontal angle is set at 135 degrees, or NW. To change the Horizontal (degrees), highlight the existing angle value. Type a new value or click and drag the to the desired angle position.
Vertical Light Angle
The Vertical (degrees) box rotates the light source in the vertical plane. A vertical angle of zero degrees places the light source at the horizon and shining horizontally. An angle of 90 degrees places the light source directly overhead and shining down onto the map. 180 degrees places the light source at the opposite horizon and shining horizontally. 270 degrees places the light source directly below the map and shining up. The default vertical angle is 45 degrees. As the vertical angle approaches zero, shadows lengthen and the overall display shifts to the colors at the left end of the color spectrum. To change the Vertical (degrees), highlight the existing angle value. Type a new value or click and drag the to the desired angle position.
Z Scale Factor
The Z scale factor box allows you to specify the Z scale to use for the surface. As you increase the Z scale factor, the surface becomes more exaggerated vertically. Increasing the factor enhances the shading effect, and can be useful for bringing out more detail, especially on relatively flat surfaces. The default Z scale factor scales the Z coordinates to 1/10th the XY diagonal of the input grid. The Z scale factor must be greater than 0. If a value less than or equal to 0 is entered into the Z scale factor box, the value will be automatically set to approximately 1.192 x 10⁻⁷.
NoData
The NoData section sets the color for grid nodes that have been assigned the NoData value.
NoData Color
To select a different NoData region color, click on the existing color to the right Color and click on the desired color from the palette. Click the ![]() button to the right of the selected color to define new colors in the Colors dialog.
button to the right of the selected color to define new colors in the Colors dialog.
NoData Opacity
To change the Opacity of the NoData regions, enter a value from 0% (completely transparent) to 100% (completely opaque) by highlighting the existing value and typing a new value or by dragging the to change the opacity percentage.