Set Limits
Click the Map Tools | Map Tools | Set Limits command or the  button to interactively set the map limits. When Set Limits is enabled, the map limits can be adjusted by clicking and dragging the sides or corners of the map limits rectangle or by drawing a new rectangle. A map, layer, or object within the map or layer must be selected before clicking the Set Limits command.
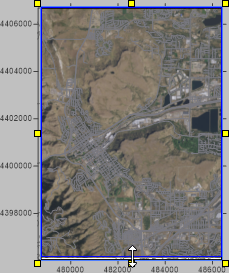
The plot window appearance changes when the Set Limits command is clicked. The areas outside the map limits are shaded. Regions of the plot window within the map limits are displayed normally. The map limits are represented by a blue rectangle with yellow selection handles. Additionally, the Map Tools | Map Tools | Set Limits command button is highlighted when Set Limits is active.
Set Limits Tips
The following keyboard and mouse actions control the Set Limits command mode.
- Click and drag the yellow selection handles to move the map limits.
- Press and hold CTRL, then click and drag to draw a rectangle to specify the map limits. The cursor will change to a crosshair
 to indicate draw mode.
 - Double-click in the plot window or press ENTER to update the map with new map limits and exit Set Limits mode. Alternatively, right-click in the plot window and click Save to update the map and exit Set Limits mode.
- Press ESC to exit Set Limits mode without making any changes to the map. Alternatively, right-click in the plot window and click Cancel to exit Set Limits mode without making changes.
- Use the mouse wheel or scroll bars to zoom and pan the plot window.
- The Undo command will undo changes to the map limits after you press ENTER or double-click the plot window. However, using the Undo command while Set Limits is activated will undo actions made prior to activating Set Limits mode. If you wish to make changes to the map limits while still in Set Limits mode, click and drag the selection handles or press CTRL and draw a new rectangle.
- The Set Limits command cannot be used with 3D surfaces or wireframes.
- The Set Limits command cannot be used with rotated, tilted, or sheared maps. Most maps have no rotation, tilt, or shear by default. If the Set Limits command is unavailable, set the Rotation to 0 and the Tilt to 90 on the Map frame View page and set the Shear to 0 with the Home | Selection | Transform command
Example
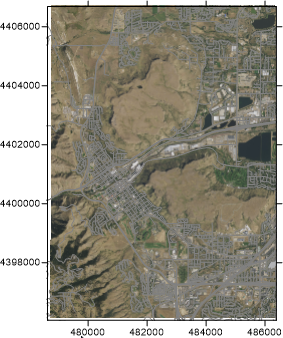
In the following example, the map limits will be set by clicking and dragging the selection handles and by drawing a rectangle. The example map includes a color relief layer, a base (raster) layer, and a base (vector) layer. The vector base layer extents are significantly larger than the extents for the other layers. We will set the map limits to a region within the image base layer extents.
|
|
|
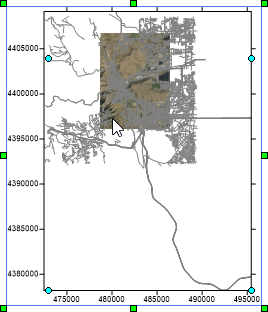
The map limits cover the entire data extents. |
- Click the map in the plot window to select it.
- Click the Map Tools | Map Tools | Set Limits command. The Set Limits mode is activated.
|
|
|
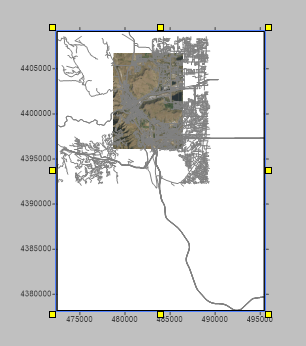
The map limits are represented by the blue rectangle. |
- Press and hold the CTRL key.
- Click and drag in the plot window to draw the new map limits.
|
|
|
|
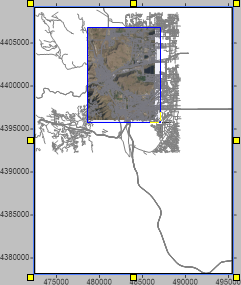
The new rectangle was drawn around the image base layer. |
|
- Double-click in the plot window, or press ENTER, to save the new limits.
- When making large changes to the map limits, as in this example, it may be necessary to change the map scale on the Properties window Scale page.
|
|
|
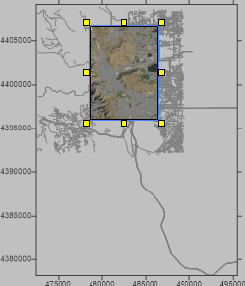
The map limits and scale have been updated. |
- The map limits still need to be reduced on the left and bottom. Click the Map Tools | Map Tools | Set Limits command.
- Click and drag the left and bottom selection handles to the desired location.
|
|
|
|
Limits can also be set by clicking and dragging the selection handles. |
|

- Double-click the plot window to save the new map limits.
|
|
|
The map limits are now in the desired location. |
Now the map limits have been updated.