Contour Volume and Area
The Grids | Calculate | Contour Vol/Area command computes the volume and area above, below, and between specific contours from a grid file or grid-based map type.
You do not need a contour map to run this command; Surfer calculates these values directly from the grid data. A minimum of two contour lines must be defined to calculate result; otherwise the result is n/a. The computation results are displayed in the Grid Contour Vol/Area Report. The report can be saved as an ASCII text file, in Rich Text Format, or the results can be copied onto the clipboard.
Units of Measurement
Units of measurement in the report are based on the units of the input grid file. For area is it square units (e.g., m2 or ft2), while volume is in cubic units (e.g., m3 or ft3).
Golden Nugget : Results are based strictly on the units of the input grid file. If your grid uses Latitude/Longitude, the area will be reported in Lat x Lon units, which is often not useful. For accurate measurements, ensure your grid is in a linear unit like feet or meters.
Calculating Volumes and Areas
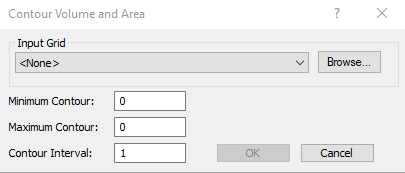
Click Grids | Calculate | Contour Vol/Area command to open the Contour Volume and Area dialog.
|
| Specify the minimum and maximum contour lines and contour interval for the sampled contour lines in the Contour Volume and Area dialog. |
Input Grid
Specify the source map layer or grid file in Input Grid. Only map layers created from grid files are included in the Input Grid list. Click Browse to load a grid file with the Open Grid dialog. If you selected an existing contour layer, the defaults for Minimum, Maximum, and Interval will match the settings of that layer
Minimum Contour
Set the Minimum contour to the value of the first contour line to be included in the calculation. To set a new value, highlight the existing value and type the new value. Press ENTER on the keyboard.
Maximum Contour
Set the Maximum contour to the value of the last contour line you want to be included in the calculation. To set a new value, highlight the existing value and type the new value. Press ENTER on the keyboard.
Contour Interval
The contour interval is the uniform difference in elevation between two consecutive contour lines.The calculation will be performed at every interval between the specified Minimum and Maximum Contour.
Note: The Simple level method is always used for this calculation, regardless of the method set in the plot properties.
Grid Contour Vol/Area Report
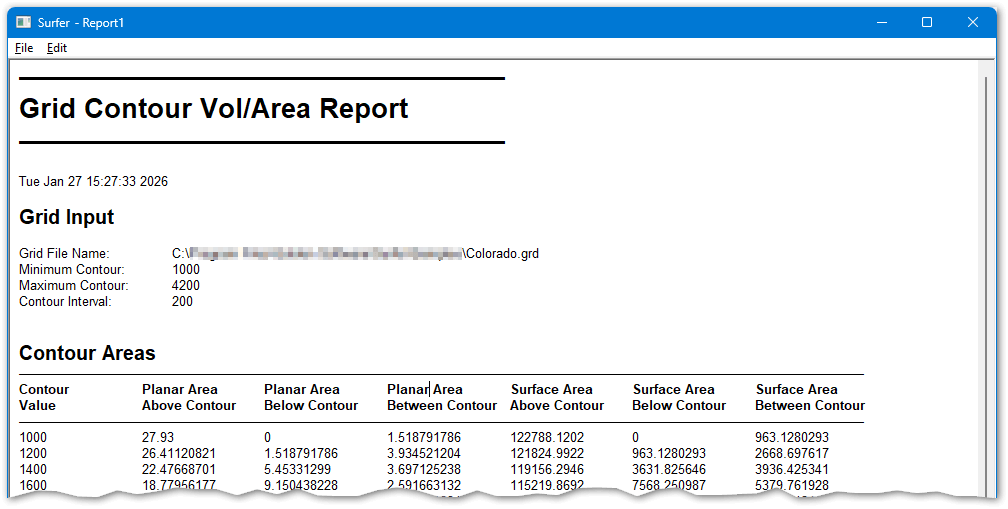
Click OK in the Contour Volume and Area dialog and the results are displayed in the Grid Contour Vol/Area Report. Use File | Save As to save the report, or you can copy the information to the clipboard and paste it into another application.
The report provides two types of area measurements, planar and surface which it reports as above, below or between various contour lines.
|
| Grid Contour Vol/Area Report window. |
Planar vs Surface area
-
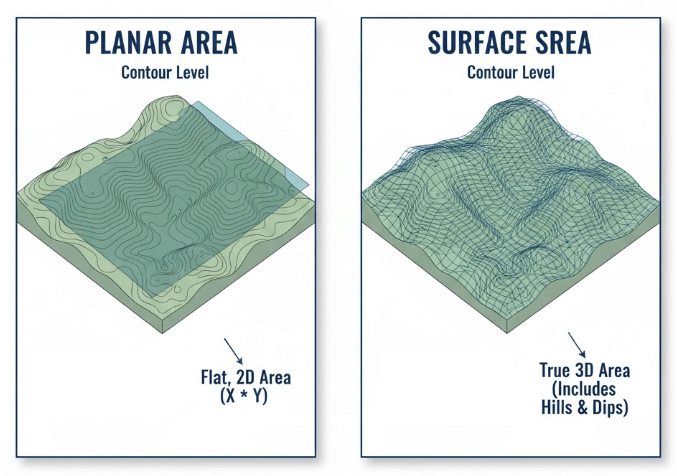
Planar Area: Represents the flat, 2D area (horizontal X x Y).
-
Surface Area: Includes the 3D "hills and dips" of the terrain. The Surface Area will always be larger than or equal to the Planar Area.
|
| Planar area vs surface area example image. |
Calculation Definitions
Each measurement is calculated relative to a specific Z-level (Contour Value):
|
Column |
Description |
|---|---|
|
Above Contour |
Everything from the specified contour value up to the highest point in the grid. |
|
Below Contour |
Everything from the specified contour value down to the lowest point in the grid. |
|
Between Contour |
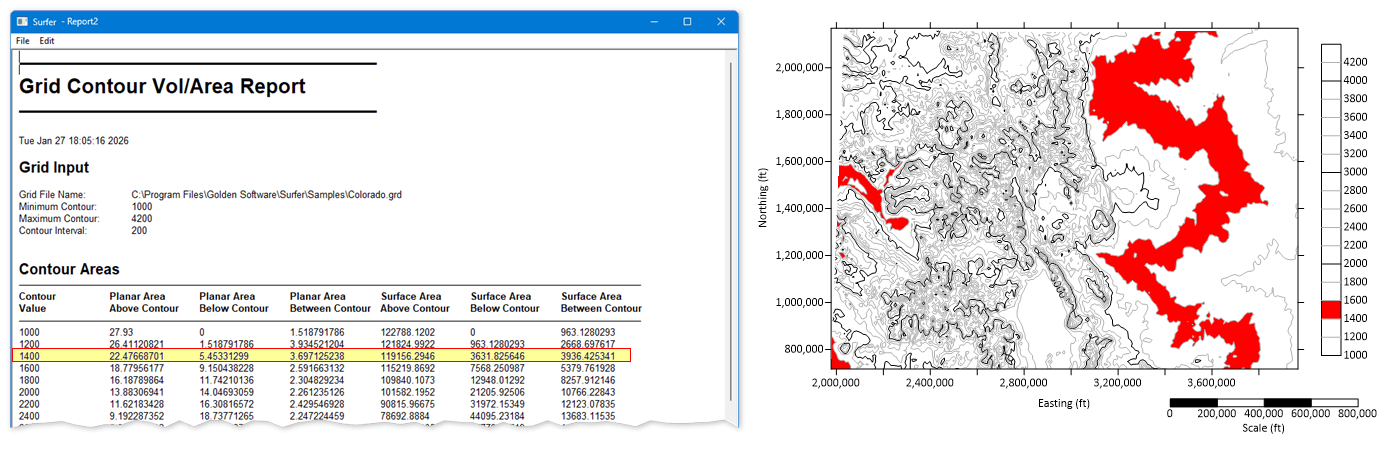
The area or volume captured between the current contour line and the next line in the interval (e.g., the slice between 1400 and 1600). |
Golden Nugget : You can achieve the same volume results as the Above Contour values using the Grid Volume command by setting the grid file as the Upper Surface and the specific contour value as a Constant Z for the Lower Surface. For Below Contour values, use the contour value as the Upper Surface and the grid file as the Lower Surface.
|
| Grid Contour Vol/Area Report and contour map highlighting the same area |
See Also
Introduction to Volumes, Areas, Cross Sections
Calculating the Volume of a Grid with NoData values