Peaks and Depressions Layer Depressions Properties
To edit the depressions in a peaks and depressions map click on the grid file in the Contents window to access the Depressions page in the Properties window. The Depressions page contains the following options:
|
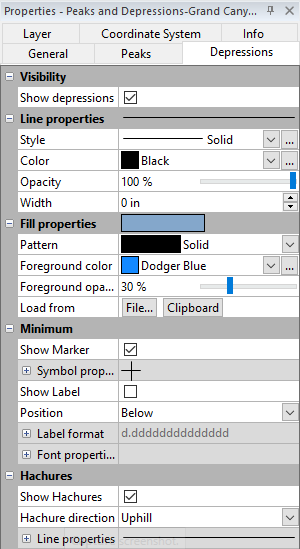
| Change the properties of depressions in the Properties window on the Depressions page. |
Visibility
Check the Show depressions box to show depressions on the map.
Line Properties
Use the Line Properties sections in the Properties window to change line properties for selected lines in the document. You can set default line properties in the Options dialog Defaults page by clicking on Line.
Style
Click the line next Style to open the line style palette. Click on a style to use it for the selected line. The line style sample updates to show the new selection. Click on the ![]() button at the right of the line style to open the Custom Line dialog, where you can specify a custom line style.
button at the right of the line style to open the Custom Line dialog, where you can specify a custom line style.
Complex line styles can be selected for most object types. Wireframe map layers and surface mesh lines do not support complex line styles. When a complex line style is selected, the line Width automatically increased to 0.03125 inches (0.079 cm). Most complex line styles require lines with the Width set to something larger than 0.03125 inches to fully distinguish the line style.
Color
Click the color next to Color to open the color palette. Click on a color to use it for the selected line. The color box and the sample line update to show the new selection. Click on the ![]() button at the right of the color sample to open the Colors dialog, where you can specify a custom color.
button at the right of the color sample to open the Colors dialog, where you can specify a custom color.
Opacity
The Opacity is the amount of transparency of the line. This is a value from 0% (completely transparent) to 100% (completely opaque). To change the value, highlight the existing value and type a new value. Press ENTER on the keyboard or click anywhere else in the Properties window to make the change. Alternatively, click and drag the  to change the opacity percentage.
Width
The Width controls the thickness of the line in page units. The value can be zero to 0.5 inches (1.27 cm) wide. A width of zero is one pixel wide. To change the Width, highlight the existing number and type a new value. Press ENTER on the keyboard to make the change. Alternatively, click the ![]() buttons to increase or decrease the width.
buttons to increase or decrease the width.
Fill Properties
Most fill properties are edited in the Properties window in a Fill Properties section. When changing fill properties for a selected object, the Fill Properties section will appear in a different location in the Properties window, depending on the type of object selected.
Fill Pattern
Change the Pattern by selecting a pattern from the fill pattern palette. Open the pattern palette by clicking the pattern button. Click on a new pattern in the list to select it.
Foreground Color
Foreground color is the color of the pattern lines or pixels. Select a new color by clicking on the color in the color palette. Only the foreground color can be applied to solid colors. The foreground colors can be applied to any stock hatch pattern or grayscale image pattern. They cannot be applied to the None pattern or non-grayscale image patterns. Click the ![]() button at the right of the color sample to open the Colors dialog, where you can specify a custom color.
button at the right of the color sample to open the Colors dialog, where you can specify a custom color.
Foreground Opacity
The Foreground opacity is the amount of transparency of the fill. This is a value from 0% (completely transparent) to 100% (completely opaque). To change the value, highlight the existing value and type a new value. Press ENTER on the keyboard or click anywhere else in the Properties window to make the change. Alternatively, click and drag the to change the opacity percentage. Opacity is disabled if it does not apply to the current pattern. Note that for true color image fill patterns the Foreground opacity applies to the image in its entirety.
Load a Fill Pattern File
To load a fill pattern from a raster image file, click the File or Clipboard button in the Load from field. The Clipboard button is only active when there is an image on the clipboard suitable to use for a fill pattern. If you select File, an Import dialog will appear. Click on the image file and click Open to load the image as the fill pattern.
Minimum
The Minimum section includes properties for displaying symbols at the depressions.
Show Marker
Check the Show marker box to mark the minimum point in the depressions or polygon(s).
Symbol Properties
Expand Symbol properties to change or set symbol properties.
Show Label
Check the Show label box to display labels.
Position
The Position controls the offset of the selected label. To change the position, select the new position from the list. Available options are Center, Left, Right, Above, Below, and User defined. User defined allows you to specify the exact offset (in page units) in the X offset and Y offset boxes.
Format
Click the  next to Label format to display the Label Format section. The numeric format is applied to all numbers read from the specified label column in this label set.
Font Properties
Click the next to Font properties to display the Font Properties section. The font properties are applied to all labels in this label set.
Hachures
Check the Show Hachures box to display hachures in the areas of the depressions. Change the direction of all the hachures to either Downhill or Uphill to indicate the direction of slope.