Peaks and Depressions Map
The Home | New Map | Specialty | Peaks and Depressions command can be used to create a peaks and depressions map from a grid file. The Home | Add to Map | Layer | Peaks and Depressions or Map Tools | Add to Map | Layer | Peaks and Depressions command adds a peaks and depressions map layer to the selected map.
A peaks and depressions map creates polygons around peaks and depressions in a grid file. The polygons represent the first or last closed polygon around an area, where drainage flows away from it (peak) or into it (depression). Peaks and depression areas can be labeled, hachured, the minimum and maximum points can be located with a symbol, and a report can be generated with statistical information about each peak and depression (e.g. length, width, height/depth, volume, orientation, etc.).
Peaks and depressions maps are useful for modeling water moving over landmasses and landscapes characterized by caves, sinkholes, fissures, and underground streams.
For example, the availability of surface water and groundwater changes over time depending on precipitation, water runoff, evaporation, seepage, and discharge. Determining the current and future water availability also depends on the geology and geography of the catchment area or the building site and water demand. Volumes of surface water and ground water are informed by topographic data, Karst topography, and geographic data, which are captured in Surfer grid files and mapped in peaks and depression maps. Boundaries can be drawn around peaks where water flows from and depressions which capture water to create unique areas for statistical analysis. Sinkholes and hills can be specifically selected and analyzed. The boundary areas can be saved for later analysis when geographic or topographic data changes.
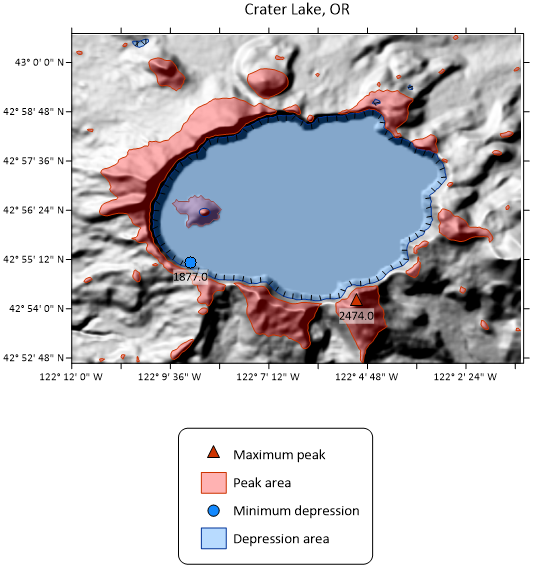
The following example peaks and depressions map is from PeaksAndDepressions.srf, which you can find in the Surfer sample files (C:\Program Files\Golden Software\Surfer\Samples).
|
| Peak areas of Crater Lake are in the default red color and the depression area is in the default blue. Hachures indicate the direction of the slope from the contour line in the depression area. The highest point is labeled with a triangle and its elevation in feet, while the lowest point is marked with a blue circle and labeled with its elevation. |
Creating Peaks and Depressions
To create a peaks and depressions map:
- Click the Home | New Map | Specialty | Peaks and Depressions command.
- Select a grid file in the Open Grid dialog and click Open.
-
If the selected file is in a format that supports 3D grids (e.g. VTK, HDF) the Data Type dialog will be displayed.
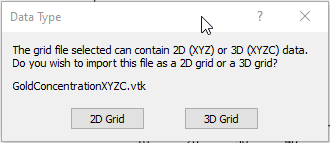
Click 2D Grid to import XYZ data or click 3D Grid to import an XYZC lattice with slice controls. If 2D grid is selected for a 3D grid file, the bottom slice (lowest Z value) will be imported.
The map is automatically created with reasonable defaults.
Editing a Peaks and Depressions Map
To change the features of the peaks and depressions map, click once on the peaks and depressions map layer in the plot window or in the Contents window to select it. The properties are displayed in the Properties window.
Adding a Map Layer
Peaks and Depression maps can be combined with any other map layer type (such as contour, post, or base layers) to display additional information. For example, overlaying a contour map on a peaks and depressions map helps visualize the specific elevations and topography that define the sinkholes and hills.
To add a layer to an existing peaks and depressions map:
-
Select the Map object or the Peaks and Depressions layer in the Plot window or Contents window.
-
Click the Home | Add to Map | Layer | [Layer Type] command (for example, Home | Add to Map | Layer | Contour).
-
Select the file or grid required for the new layer and click Open.
The new layer is automatically added to the existing watershed map axes.
To combine existing separate maps:
If you have already created a peaks and depressions map and a separate map (such as a contour map) using the Home | New Map commands, you can easily combine them. Simply click on the map layer (e.g., the contour layer) in the Contents window, hold down the left mouse button, and drag the map layer into the peaks and depressions map object. This creates a single map with two map layers using one set of axes and scaling parameters.
Any number of peaks and depressions maps can be combined with any other map layers.
Peaks and Depressions Layer Properties
The peaks and depressions map properties contains the following pages:
Map Properties
The map properties contains the following pages: