Symbology - Unclassed Symbols
The Unclassed Symbols symbology adds proportionally scaled symbols to the map. The proportional symbol map is useful for indicating the relative difference in a value between areas.
When the Unclassed Symbols symbology is applied to polygon features, symbols are created in addition to the polygon features. When the Unclassed Symbols symbology is applied to point features, the point feature symbol properties are controlled by the symbology. Unclassed Symbols symbology is not applied to polyline features.
|
|
|
Select Unclassed Symbols to add proportionally scaled symbols to the map. |
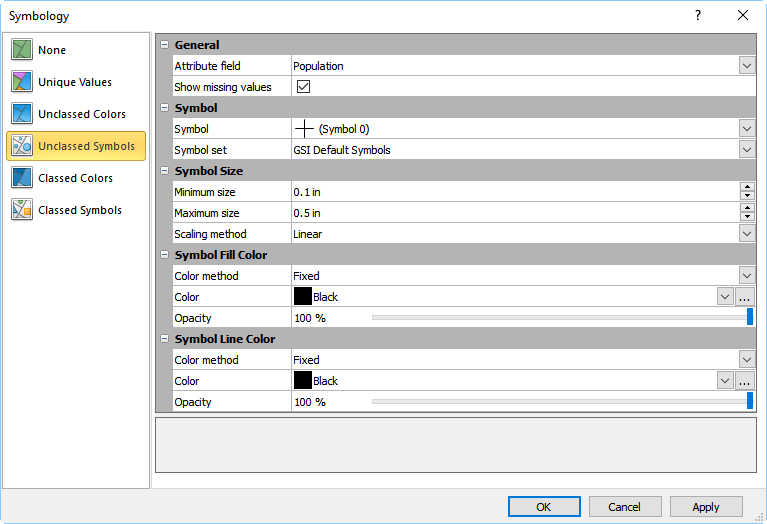
General
The General section includes the Attribute field and Show missing values properties.
Attribute Field
The Attribute field specifies which attribute is used to scale the symbols. Select the desired attribute from the Attribute field list. Only attributes with numeric values are displayed in the Attribute field list when the Unclassed symbols symbology is selected.
The first numeric attribute for the objects in the layer is the default selection in the Attribute field when a symbology is selected for the first time. When a base layer symbology using a numeric attribute is already applied, the Attribute field value is not changed when Unclassed Symbols is selected. The Attribute field changes to the first numeric attribute for the objects in the layer when Unclassed Symbols is selected and the base layer is currently using a text attribute for the current symbology.
Show Missing Values
Select the Show missing values option to include any features that do not have an attribute value for the selected Attribute field in the layer. When the Show missing values option is checked, features that do not have an Attribute field value are displayed, and their properties are controlled by the base layer General page, as well as their individual Line, Fill, and/or Symbol properties.
Clear the Show missing values check box to hide the features that do not have an Attribute field value from the base layer. The features will still be visible in the Contents window, but the features will not be included in the base layer in the plot window.
Symbol
The properties in the Symbol section control the appearance of the symbols, including the Symbol and Symbol set.
Symbol Size
The Symbol Size section includes properties for scaling the symbols.
Minimum and Maximum Size
Specify the smallest and largest symbol sizes in the Minimum size and Maximum size fields. The feature with the minimum attribute value is created with the Minimum size. The feature with the maximum attribute value is created with the Maximum size. The remaining features' symbols are scaled proportionally between the Minimum size and Maximum size by the Scaling method.
Scaling Method
The Scaling method specifies which scaling type is used to determine symbol sizes between the minimum and maximum. Select Linear or Square root from the Scaling method list. The interpolation equations for the scaling methods are as follows:
|
Linear: |
|
|
Square Root: |
|
Square root scaling is commonly used with solid symbols to offset the fact that the area increases as a function of the symbol height squared. Square root scaling is essentially making the area of the symbol proportional to the Z value, rather than making the size of the symbol proportional to the Z value.
Symbol Fill and Line Colors
The Symbol Fill Color section specifies the symbol fill color method and color. The Symbol Line Color section specifies the symbol line color method and color. Symbol fill and line colors are set separately.
Color Method
The Color method property sets whether the symbols use a single color or the symbols are colored by their attribute value. Select Fixed to use a single color for all symbols. Select Colormap to color the symbols by their attribute values.
Color
Specify the symbol color when the Color method is Fixed in the Color field. Select a color from the color palette.
Opacity
Specify the symbol opacity when the Color method is Fixed in the Opacity field. Select a value between 100% (completely opaque) to 0% (completely transparent).
Colormap
Select a predefined colormap in the Colormap field when the Color method is Colormap . Create a custom colormap in the Colormap Editor by clicking the  button.
OK, Cancel, and Apply
Click OK to save your changes, close the Symbology dialog, and update the base layer symbology. Click Cancel to close the Symbology dialog without making changes to the base layer symbology. Click Apply to apply your changes to the base layer while keeping the Symbology dialog open.