Symbology - Unique Values
The Unique Values symbology applies line, fill, and/or symbol properties to the features in the base layer for the values in the attribute field. Display properties for some or all of the unique values in the attribute field can be specified. Line properties are applied to polyline and polygon features. Fill properties are applied to polygon features. Symbol properties are applied to point features.
The Unique Values symbology does not add features to the map. For example, setting the symbol properties for a base layer without point features makes no change to the base layer appearance.
|
|
|
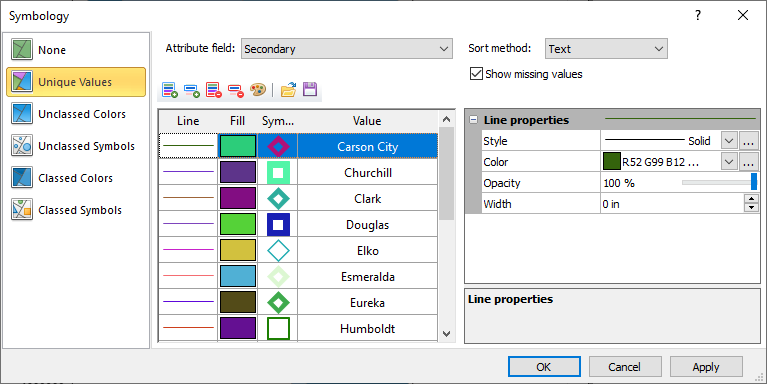
Select Unique Values to specify properties for unique values in the Attribute field. |
Attribute Field
The Attribute field specifies which attribute is used to define the features' properties in the base layer. Select the desired attribute from the Attribute field list. When the Attribute field value is changed, the values in the Values List are removed.
The first attribute for the objects in the layer is the default selection in the Attribute field when a symbology is selected for the first time. The Attribute field value is not changed when Unique Values is selected and a symbology is already in use.
Sort Method
The Sort Method specifies the sort order for the unique values in the Symbology and Add Unique Values dialogs and the legend. The Sort Method automatically updates when an Attribute field is selected. If the first ten values in the selected Attribute field are numeric, then the Sort Method becomes Numeric. Otherwise, the Sort Method is set to Text.
Select Text to sort the unique values alphabetically from A to Z. Select Number to sort the unique values from low to high. Select None to use the same order as the features in the Contents window in the Symbology dialog and to sort the values alphabetically in the Add Unique Values dialog.
Show Missing Values
Select the Show missing values option to include any features that do not have an attribute value equal to one of the values in the Values list in the map. When the Show missing values option is checked, features that are not represented by a value in the Values list are displayed, and their properties are controlled by the base layer General page, as well as their individual Line, Fill, and/or Symbol properties.
Clear the Show missing values check box to hide the features that are not represented in the Values list from the base layer. The features will still be visible in the Contents window, but the features will not be included in the base layer in the plot window.
Values List
The values list displays the selected unique values and their associated properties. Values are added and removed by clicking the command buttons above the list. Click the Line, Fill, or Symbol property preview to display the properties in the properties pane. The properties preview is updated automatically when changes are made in the properties pane.
Add All
Click the Add All command  to add all unique values in the Attribute field to the values list.
Add Values
Click the Add Values command  to add one or more unique values to the values list. Select the desired values in the Add Unique Values dialog. The Add Unique Values dialog displays all available unique values in the Attribute field. Values that have already been added to the Symbology dialog are not displayed in the Available values list.
|
|
|
Select unique values to add to the values list . |
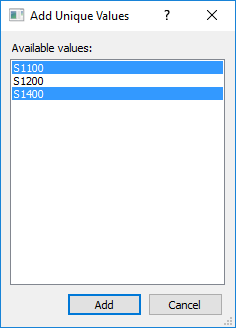
Click a value to select the value. Hold CTRL to select multiple values. Click a value, hold SHIFT, and click a second value to select a contiguous group of values. When you have selected the desired unique values, click Add to add the values to the values list in the Symbology dialog. Click Cancel to close the Add Unique Values dialog without adding any values to the list.
Remove All
Click the Remove All command  to remove all unique values from the values list.
Remove
Click the Remove command  to remove the selected value from the list.
Color Scheme
Click the Color Scheme command  to apply a color scheme to the line, fill, and/or symbol properties in the unique values list in the Color Scheme dialog.
|
|
|
Select color scheme properties to change the color properties for every unique value in the Symbology dialog. |
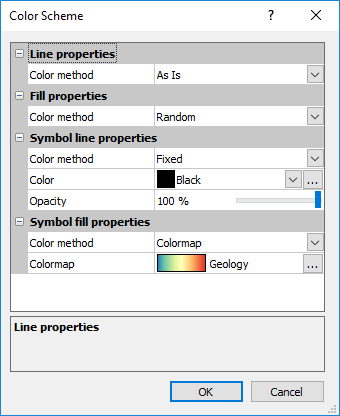
Select the Color method to apply a scheme to the unique values' line, fill, symbol line, and/or symbol fill properties. The Line properties, Fill properties, Symbol line properties, and Symbol fill properties are all applied independently.
- Select As Is to make no changes to the current colors for the unique values. As Is is selected by default each time the Color Scheme dialog is opened.
- Select Random to apply random colors to the unique values.
- Select Fixed to apply a single Color and Opacity to all unique values.
- Select Colormap to apply a colormap to the unique values properties. The colormap is applied in the order the unique values appear in the Symbology dialog.
Save and Load Values
Click the Save Values command  to save the unique values and their properties to a Symbology Unique Values File (*.ssuv) in the Save As dialog. The Save Values command is only available after at least one value has been added to the current table.
Click the Load Values command  to load unique values with their properties from a Symbology Unique Values File (*.ssuv) in the Open dialog. Values from the file are added to the Unique Values table. If the file includes a value that is already listed in the Unique Values table, the properties of the existing value are maintained and the loaded value is ignored.
Line, Fill, and Symbol Properties
The line, fill, and symbol properties for the selected value are displayed on the right side of the Symbology dialog. No properties are displayed when no value is selected.
- To edit the line properties for a value, click the line preview in the row for the value. The line properties are applied to any polylines and/or polygons with this value in the Attribute field.
- To edit the fill properties for a value, click the fill preview in the row for the value. The fill properties are applied to any polygons with this value in the Attribute field.
- To edit the symbol properties for a value, click the symbol preview in the row for the value. The symbol properties are applied to any points with this value in the Attribute field.
Name Properties
-
Value : The Value field shows the corresponding value from the Attribute Field for each unique value in your data.
-
Name : The text shown in the legend comes from the Name field, which you can change. Initially, the Name field will be the same as the Value field.
The default template for the base symbology with unique values is \fill \line \symbol \name
Golden Nugget : When loading old files (prior to the 'Name' column being added) or files saved using old serialization, all of the loaded values will default to having their names be the same as their attribute values.
OK, Cancel, and Apply
Click OK to save your changes, close the Symbology dialog, and update the base layer symbology. Click Cancel to close the Symbology dialog without making changes to the base layer symbology. Click Apply to apply your changes to the base layer while keeping the Symbology dialog open.