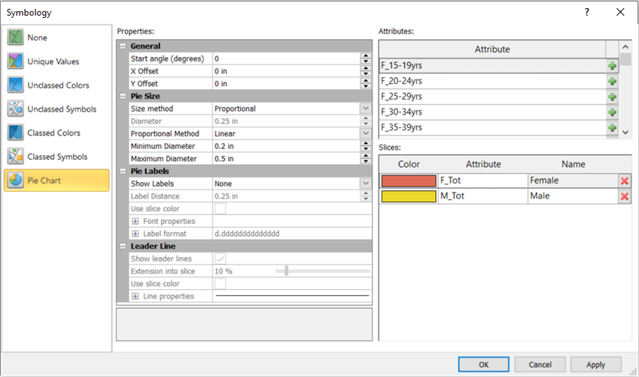
Symbology - Pie Chart
The Pie Chart symbology adds circles divided into sectors that can be proportionally sized. The features in the base layer are classified by the selected attribute. The symbols for each class can be assigned individually or graduated symbols can be assigned across the classes.
|
|
|
Select Pie Chart to add pie chart symbols to the map for select attributes. |
Properties
The Properties pane includes the properties for selecting the attribute and defining the classes. The Properties pane is in the middle of the Symbology dialog.
Start Angle
The Start Angle value specifies the initial pie slice angle in degrees.
X Offset
Placement of the group of pie chart symbols can be changed in the left-right direction relative to the center of the feature in inches. The X Offset value controls the horizontal placement of the pie chart symbols.
Y Offset
The Y Offset value controls the vertical placement of the group of pie chart symbols in the up-down direction relative to the center of the feature in inches.
Size method
The Size method value specifies whether the group of pie charts will be proportionally sized relative to its feature, or fixed in size. Fixed uses the same size symbols throughout the map. Select Proportional to resize each pie chart symbol relative to its feature. The proportionality is defined by the Proportional Method, Maximum Diameter and Minimum Diameter properties.
Diameter
When Fixed is selected as the Size method, then the diameter of all the pie chart symbols can be specified to 1/100th of an inch.
Proportional Method
The Proportional Method specifies which scaling type is used to determine symbol sizes between the minimum and maximum. Select Linear or Square Root from the list.
If the Proportional Method is set to Linear, a standard linear interpolation is used:

|
If the Proportional Method is set to Square Root, a standard square root interpolation equation is used:
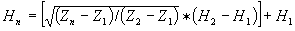
|
Minimum Diameter
When Proportional is selected as the Size method, the Minimum Diameter of the pie chart symbols can be set in inches.
Maximum Diameter
When Proportional is selected as the Size method, the Maximum Diameter of the pie chart symbols can be set in inches.
Show Labels
Display the labels for the Slices of the pie chart symbols in Value or in Percentage.
Label Distance
Set the distance in inches from the edge of the slice to the label.
Use Slice Color
Select Use slice color to match the label color with the slice color.
Font
Click the  next to Font properties to display the Font Properties section. The font properties are applied to all labels in this label set.
Format
Click the next to Label format to display the Label Format section. The numeric format is applied to all numbers read from the specified label column in this label set.
Show Leader Lines
Select Show leader lines to display a line from the slice to its label.
Extension Into Slice
Use the slider bar to adjust how much of the leader line overlaps into the slice.
Use Slice Color
Select Use slice color to match the leader line color with the slice color.
Line Properties
Click the next to Line properties to display the Line Properties section. The line properties are applied to all leader lines.
Attributes
The Attributes list displays the categories of information that can be displayed in the pie charts. The Attributes list is on the right side of the Symbology dialog. Click on the  to add a category to table of Slices.
Slices
The Slices table displays the slice Color assigned to the Attribute. The Name is that which will be displayed in the Legend next to the slice color for the attribute. Use the Slices table to change the Fill Properties and Border Properties for each slice, change the Name of the slice, or remove the attributes by clicking  at the right side of the row.
OK, Cancel, and Apply
Click OK to save your changes, close the Pie Chart dialog, and update the base layer symbology. Click Cancel to close the Pie Chart dialog without making changes. Click Apply to apply your changes to the base layer while keeping the Pie Chart dialog open.
Legend Properties
You can add a legend to a Base layer with Pie Chart Symbology. Click the Map Tools | Add to Map | Legend command to add a legend and then click the Legend object in the Contents window to display legend properties. Most of these properties, such as the General and Info properties, are similar to legends in other maps (see the Legend help topic)
Base Pie Chart Symbology Legend Properties
The Layers page in the Properties window controls which layers are included in the legend and the appearance of the legend. See the Legend Layers Properties page for more details. The Base Layer section of the Layers section will include these variables.
-
The Template box customizes the format of the legend items
-
The Fill sample size property controls the size of the fill sample square in the legend.
-
Set the length of the Line sample size, independent from the fill sample size.
-
Enter a value in the Sample spacing field to define the spacing between the lines in the legend.