Variogram Model
The variogram model mathematically specifies the spatial variability of the data set and the resulting grid file. The interpolation weights, which are applied to data points during the grid node calculations, are direct functions of the variogram model.
|
|
|
A variogram model demonstrating the variogram parameters. |
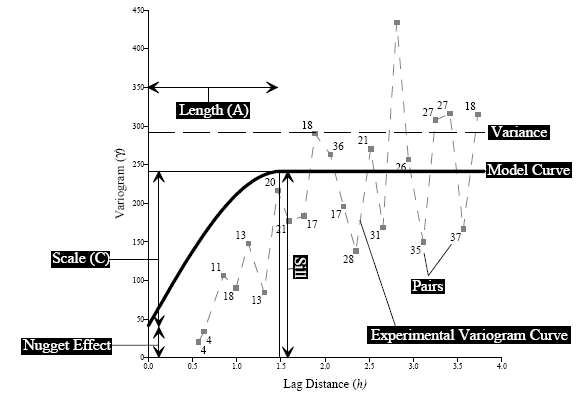
Nugget Effect
The Nugget Effect quantifies the sampling and assaying errors and the short scale variability (i.e. spatial variation occurring at distance closer than the sample spacing).
Partial Sill
The Partial sill (C) is the vertical scale for the structured component of the variogram. Each component of a variogram model has its own scale.
Sill
The Sill is the total vertical scale of the variogram (Nugget Effect + Sum of all component Scales). Linear, Logarithmic, and Power variogram models do not have a sill.
Range
The Range (Length) is the horizontal range of the variogram. (Some variogram models do not have a range parameter; e.g., the linear model has a slope instead.)
Variance
The Variance is the mean squared deviation of each value from the mean value. Variance is indicated by the dashed horizontal line in the diagram shown above.
 where: N is the number of data
Pairs
Pairs represents the average variogram value for the group of pairs separated by a specified distance (lag width). The number adjacent to the square symbols indicates the number of pairs within each lag distance.
Model Curve
Model Curve shows the shape of the variogram model.
Experimental Curve
Experimental Curve displays the groups of variogram pairs on a plot of separation distance versus the estimated variogram.
For more information on the nugget effect, scale, and length settings, see the Model Page.