Variogram Model Properties
The Model page in the Properties window allows you to set a specific variogram model and its parameters. Computing an experimental variogram from your data is the only certain way to determine which variogram model you should use. There are lengthy chapters in many geostatistics textbooks discussing the tools and techniques necessary to generate a variogram (e.g. Isaaks and Srivastava, 1989).
|
|
|
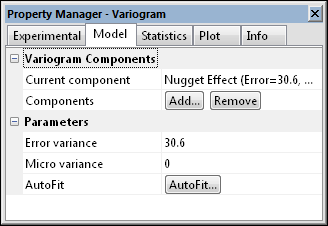
Options such as the variogram model are set on the Model page. |
Surfer allows for a general nested variogram model. There are no limits on the number of models that can be nested in Surfer. Because of this, there are hundreds of possible combinations of variogram models.
Current Component
Click the item next to Current component to select a different variogram component to edit. A list appears containing all of the components defined for the current variogram. When you select a component, the properties of that component are shown in the Parameters section.
Add Components
Click the Add button to open the Add Component dialog and add a variogram component. There are twelve common variogram functions: Nugget Effect, Spherical, Exponential, Linear, Gaussian, Wave (Hole-Effect), Quadratic, Rational Quadratic, Logarithmic, Power, Cubic, and Pentaspherical. Each of the components allow for independent specification of the anisotropy, except for the nugget effect.
Remove Components
Select a Variogram Component and click the Remove button to remove a variogram component.
Partial Sill (C)
With the exception of the Linear, Logarithmic, and Power variogram models (which do not have a sill), the Partial sill parameters (denoted by C in the variogram equations) define the sill for the variogram components you select. Thus, the sill of the variogram model equals the Nugget Effect plus the sum of the component’s Partial sill (C) parameters. In many situations, the variogram model sill is approximately equal to the variance of the observed data (see Barnes, 1991).
Range (A)
The Range (A) parameters define how rapidly the variogram components change with increasing separation distance. The Range (A) parameter for a variogram component is used to scale the physical separation distance. For the Spherical and Quadratic variogram functions, the Range (A) parameter is also known as the variogram range. In an isotropic setting, the relative separation distance, h, is computed by the following equation:
|
|
where
![]() is the separation vector (in map coordinates), and
is the separation vector (in map coordinates), and
A is the component’s Range parameter.
The anisotropically rescaled relative separation distance for the variogram equations is computed by the following matrix equation
|
|

where
![]() is the separation vector (in map coordinates),
is the separation vector (in map coordinates),
A is the component’s Range parameter.
![]() is the anisotropy Angle, and
is the anisotropy Angle, and
![]() is the anisotropy Ratio.
is the anisotropy Ratio.
With a Linear variogram model, the slope is given by the Partial sill divided by the Radius. By allowing an anisotropic radius, it is possible to specify an anisotropic linear variogram slope. The slope of the linear variogram makes no difference in the kriging algorithm if the nugget effect is zero.