Axis Grid Line Properties
Grid lines are a mesh over the top of the map. Along an axis, grid lines can originate from the major ticks, minor ticks, or both. The major and minor grid lines can use different line properties. When grid lines are added to 3D wireframe or 3D surface maps, the lines are drawn on the plane defined by the base of the map.
Grid lines are drawn over the extent of the map. For example, if you draw grid lines for an X axis (the Bottom Axis), the grid lines are drawn parallel to the Y axis (Left Axis) over the entire map. If your X axis is offset from the Y axis, the grid lines are not drawn beginning at the end of the X axis, but beginning at the minimum Y value on the map.
Specify the tick spacing to use for the grid lines on the Scaling page. The ticks do not need to be displayed for the grid lines to be drawn.
|
|
|
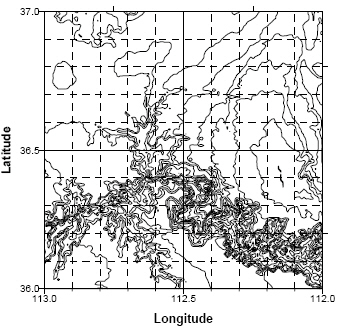
Grid lines originate from the tick marks. Different line properties can be used for the major and minor grid lines. In this example, major grid lines are solid and minor grid lines are dotted. |
Grid Lines Page
The Grid Lines page controls the visibility and properties of major and minor grid lines.
|
|
|
Specify the axis grid line properties in the Properties window on the Grid Lines page. |
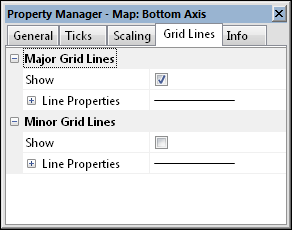
Major Grid Lines
If you want grid lines to extend from the major ticks, check the Show box in the Major Grid Lines section. Click the ![]() next to Line Properties to open the line properties section for the Major Grid Lines. Change the Style, Color, Opacity, and Width for the major grid lines.
next to Line Properties to open the line properties section for the Major Grid Lines. Change the Style, Color, Opacity, and Width for the major grid lines.
Minor Grid Lines
If you want grid lines to extend from the minor ticks, check the Show box in the Minor Grid Lines section. Click the ![]() next to Line Properties to open the line properties section for the Minor Grid Lines. Change the Style, Color, Opacity, and Width for the minor grid lines.
next to Line Properties to open the line properties section for the Minor Grid Lines. Change the Style, Color, Opacity, and Width for the minor grid lines.
To Draw a Grid Covering the Map
-
Click on an axis to select it. The axis properties are automatically displayed in the Properties window.
-
Specify the tick spacing to use for the grid lines on the Scaling page. The ticks do not need to be displayed for the grid lines to be drawn.
-
Click the Grid Lines tab.
-
If you want grid lines to extend from the major ticks, check the Show box in the Major Grid Lines section.
-
Change the options under Line Properties for the Major Grid Lines. You can change the Style, Color, Opacity, and Width for the major grid lines.
The grid lines are drawn on the map as you make changes in the Properties window.