Variogram Frequently Asked Questions
Q. What is a variogram?
A. A variogram is a statistically-based, quantitative, description of a surface's roughness. A variogram is a function of a separation vector: this includes both distance and direction, or a Dx and a Dy. The variogram function yields the average dissimilarity between points separated by the specified vector (dissimilarity is measured by the squared difference in the Z-values).
Q. What is the difference between a variogram and a semi-variogram?
A. The difference is simply a factor of 2. The variogram was originally defined as
|
|
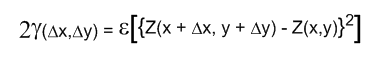
where 2g( ) was given the name variogram. The function of practical interest was g( ) which was given the name semi-variogram since it is one-half the variogram function. Since only the function g( ) is used in kriging, the prefix semi- is regularly dropped, and the function g( ) is interchangeably called the variogram and the semi-variogram in the geostatistical literature.
Q. What are the units of the variogram plot?
A. Let (X, Y) represent the location of an observation, and let Z represent the associated observed value. The abscissa (lag distance axis) has the same units as X and Y. The ordinate (variogram axis) has the units equal to the units of Z squared (like the variance of Z). For
example, let
-
X represent the distance east of a benchmark measured in [m],
-
Y represent the distance north of a benchmark also measured in [m], and
-
Z represent rainfall intensity measured in [cm/hr].
The abscissa subsequently has units of [m], and the ordinate has units of [(cm/hr)2].
Q. Why can't I specify the sill in the variogram parameters? How is the scale related to the sill?
A. The sill is the value of the ordinate at which the variogram levels off. A variogram model may be comprised of multiple components (e.g. a spherical component plus a nugget effect). While the individual components may be said to have a sill, such usage often leads to confusion between the sill of the overall model and the various sills of the individual components. A further source of confusion is that some components, and therefore models including such components, do not have a sill (e.g. the linear model).
To reduce confusion, the word sill was used to describe the leveling-off of the entire model, and not of the individual components. When discussing the leveling-off of an individual component, we use the term scale.
Q. What does the variogram direction do? Why does the variogram change when I change the direction?
A. This behavior is called anisotropy. The variogram measures dissimilarity as a function of separation distance and direction. In many physical settings it is possible for the variable of interest to change more rapidly in one direction than in another. For example, the distribution of grain size changes more rapidly in a direction perpendicular to the shoreline than it does parallel to the shoreline. Similarly, in an arid climate the prevalence of certain species of plants changes more rapidly as one moves in a direction perpendicular to a river than it does as one moves along the river.; i.e. different behavior in different directions. The direction parameter allows you to investigate the variogram in different directions. Thus, you can identify and quantify the anisotropy.
Q. Are the various variogram directions used when gridding with Surfer?
A. Yes. The variogram anisotropy is explicitly entered when specifying the variogram for gridding with the kriging algorithm.
Q. Does Surfer have a multi-directional gridding algorithm so that more than just the anisotropy can be changed (different sills in different directions)?
A. The variogram model contains the necessary information to describe the behavior of the variogram in all directions. The spherical model, for example, is a funnel-like surface. The variogram plot on which a single line is drawn to represent the variogram model is a vertical slice through the variogram model.
The anisotropy ratio and angle describe the ratio of the Lengths (A) in different directions (geometric anisotropy). Sometimes the apparent sill of the experimental variogram differs in different directions (zonal anisotropy). For example, an experimental variogram appears to be well described by a spherical model with a Length (A) of 100 meters. It levels off (sill) at 2.0 in the East/West direction (Angle = 0 degrees), while it levels off at 3.0 in the North/South direction (Angle = 90 degrees). Surfer can reproduce such behavior using a nested model. Make the first component an isotropic spherical model with a length of 100 and a scale of 2. Make the second component be an anisotropic model with length 100, ratio1000, direction 90, and scale of 1. Adding the two components results in a compound model with a sill of 2 in the East/West direction and a sill of 3 in the North/South direction.
Q. Why are some of the cells blank when exporting variogram data?
A. A cell is blank when there are no data pairs separated by the specified lag distance interval and angular tolerance represented by the cell.
Q. How do I perform kriging cross-validation, jack-knifing (leave-out-one modeling), and such.
A. The Grids | New Grid | Grid Data command in Surfer offers an extensive set of cross-validation tools. The Cross Validation Report (using the Kriging gridding method) offers numerous quantitative measures that can be used as a goodness-of-fit statistic for the variogram. We recommend three particular statistics as the most consistently useful: the median absolute deviation of the cross validation residuals, the standard deviation of the cross validation residuals, and the rank correlation between the measurements and the estimates.
Q. How do I plot the 3D variogram surface?
A. This option is not available in Surfer.
Q. Does Surfer calculate S2 (variance of the data) and how do we find this value in the program outputs?
A. Surfer uses the formula for calculating the sample variance in the experimental variogram. This value is reported in the Statistics tab of the Variogram Properties and in the Variogram Report.
Q. Why doesn't the grid change when using a linear variogram with different slope values?
A. This occurs if there is no nugget effect. Changing the slope of a linear variogram is equivalent to changing only the scale of the observation locations; thus, the ratio of the variogram values between any two pairs of points is unchanged by changing the slope. It is important to note, however, that the kriging variance is sensitive to the slope even if the interpolation weights and interpolated value are not.
Q. How can I get information on the distance between data points?
A. Plot your data as a post map (see the Home | New Map | Post command). Surfer reports some useful quantitative statistics in the Variogram Report and at the bottom of the table on the Statistics tab of the variogram properties. For example, the Nearest Neighbor (NN) values for the ExampleDataSetC.xls are:
-
Avg. distance to nearest neighbor: 2.90403
-
Min. distance to nearest neighbor: 1
-
Max. distance to nearest neighbor: 9.48683
-
Gamma for nearest neighbors: 64.735
In addition, the Grids | New Grid | Grid Data menu with the Data Metrics gridding method offers an extensive suite of tools for characterizing the data geometry. This includes a neighborhood count, data density, distance to the nearest neighbor, etc.
Q. When using an exponential variogram model for kriging, is the input parameter Length (A) the correlation length (i.e. the length at which the variogram value reaches 63 percent of the sill) or the practical range (i.e. the length at which the variogram value reaches 95 percent of the sill)?
A. Different geostatistical software packages use various definitions for the length parameter of an exponential model. Surfer defines the Length (A) parameter, as the correlation length. Graphically, the correlation length corresponds to the lag distance at which the tangent line to the curve at lag distance zero intersects the sill of the exponential model. The exponential model achieves about 63 percent of the sill at Lag Distance (A). At a lag distance of 3A the exponential model reaches about 95 percent of the sill.
Q. When applying the Gaussian model, I seem to be getting a mismatch between what I see on the plot of the variogram and the length reported by the software after AutoFit has finished. The length at which the sill is reached seems to be much larger than the value reported under the Model tab when AutoFit has finished.
A. As with the exponential model, different geostatistical software packages use various definitions for the Length (A) parameter of a Gaussian model. Surfer defines the Length (A) parameter as the correlation length. Graphically, the correlation length corresponds to the lag distance of the inflection point of the curve. The Gaussian model achieves about 63 percent of the sill at Lag Distance (A). At a lag distance of 3A the Gaussian model reaches about 99.99 percent of the sill.
Q. Is there a function in the variogram procedure in the new Surfer that can actually tell me the exact nugget, length, and scale?
A. To view the nugget, length, and scale, choose the Grid | Variogram | New Variogram command. Specify the data file, click the Open button, and click OK to use the defaults. Click on the variogram graph and the variogram properties are listed in the Properties window on the Model tab. The Nugget Error and Micro Variance are listed for the nugget and the default linear model Slope and Anisotropy parameters are listed for the linear component. Other components have other options, such as Scale or Length (A) listed.
Q. I tried to fit a spherical variogram using AutoFit and all the standard settings. The fit is poor. Could you explain how Surfer does the fitting? How can I make an appropriate fit using the spherical function?
A. The AutoFit function requires reasonable initial parameters to arrive at a good fit. Examine the plot of the experimental variogram and estimate the Length (A) and Scale visually. If it is difficult to estimate the scale from your data set, use the Z variance listed in the Variogram Report and on the Statistics tab of the variogram properties.
Q. I set the Lag Width to a particular value. Why aren't the points on the variogram plotted at multiples of this value?
A. The Lag Width defines the midpoint of a range plus or minus half the lag width. The point is plotted at the average separation distance for all points within that range.
Q. How can I get a list of the average separation distances?
A. Export the variogram to a data file. This file includes the average lags, half the average variance, and the number of pairs in the range.
Q. Is it possible to create a grid file from two juxtaposed areas on which different variogram models are applied? The areas have spatially contrasted morphologies.
A. If the areas are defined by rectangles, you may be able to grid each area with a separate model, convert the grid to XYZ data files, import the data files in the worksheet and regrid using the Nearest Neighbor method to prevent further interpolation.
Q. How is the drift used within the kriging algorithm? Should the modeling be done on transformed data (data minus drift) or on non-transformed data? Kriging with prior removal of the trend is different than Universal Kriging.
A. We recommend calculating the variogram model of the detrended data prior to applying drift during kriging, after Kitanidis, 1997, p. 143, section 6.12.
Q. I haven't found any procedure in Surfer that can help me to tell HOW well the theoretical variogram models are fitted to the experimental data in my variogram. I understand that I can use AutoFit but I would like a quantitative number that measures the goodness-of-fit.
A. The best measure of "how well" the theoretical model fits the data is to try it out and see. Grid the data with the selected variogram model. Create a contour map and overlay a post map of the data file. Judge the quality of the model by examining the contour map. The Cross Validation Report (using the Kriging gridding method) offers numerous quantitative measures that can be used as a goodness-of-fit statistic for the variogram. We recommend three particular statistics as the most consistently useful: the median absolute deviation of the cross validation residuals, the standard deviation of the cross validation residuals, and the rank correlation between the measurements and the estimates.
Q. Can Surfer import a variogram model from Variowin, GeoEAS, GSLIB, or other software?
A. Surfer does not have this feature. Click Help | Contact Us | Technical Support to submit a request with the name of the software you would like to support.
Q. I've read somewhere that the scale should not exceed the variance. Is this true? For the data set ExampleDatSetC.xls, the variance of Z is 405.371, but you recommend a scale of 425.
A. Under a reasonable and commonly applicable set of assumptions, the sill of the variogram should be equal to the variance of the underlying population; however, the sample variance is often an inappropriate measure of the population variance (the standard formula for estimating the variance assumes independent data, which is invalid in most geological settings). Thus, a rule like "the scale should not exceed the variance" is not a useful generalization. The critical result is
|
|
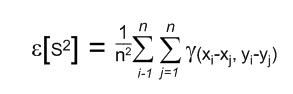
This result states that the expected value of the sample variance, S 2, is equal to the average value of the variogram between all n 2 pairs of sample values. If the n sample values are evenly distributed over an areal extent many times larger than the range of the variogram, then there will be significantly more pairs at long separation distances and fewer pairs at short separation distances. Thus, the average value of the variogram between all pairs will be the average of many values equal to the sill and a few values less than the sill. In this case, the sample variance is a reasonable first estimate for the variogram sill.
Back to Variogram Modeling Rules of Thumb
Next to Geostatistical References