Legend
Click the Map Tools | Add to Map | Legend command or the  button to add a legend to the plot. The legend can include any number of post, classed post, 1-grid vector, 2-grid vector, and base symbology layers from any of the maps in the plot. However once a layer is included in a legend, it cannot be added to any other legends. The total number of legends is limited to the total number of post, vector, and base layers in the plot, i.e. each layer can have its own legend. Once all of the post, classed post, 1-grid vector, 2-grid vector, and base layers are represented in a legend, the Map Tools | Add to Map | Legend command button is disabled. Every layer that is not already included in a legend is added automatically when a new legend is created. Use the Layers in Legend section of the Properties window Layers page to control which layers are included in the legend.
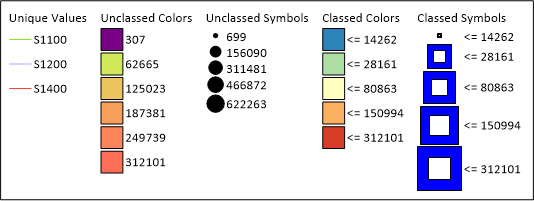
Base Symbology Legends
When a base layer includes a symbology, a legend can be displayed for the base layer. Unique values legends can include the value, fill, line, and symbol samples, and the legend order is determined by the order in the Symbology dialog. Unclassed colors legends can include fill value and fill samples. Unclassed symbols legends can include value and symbol samples. Classed colors legends can include the upper limit value, class name, and fill samples. Classed symbols legends can include the upper limit value, class name, and symbol samples. Pie chart symbols can be relatively sized and can include slice colors with labels.
Drillhole Layer Legends
When a drillhole layer Symbol property for Symbol method in the Hole Top Symbol section is set to By collar, a legend can be added to a drillhole layer. The legend will display the hole top symbol and the hole id from the collars data. See drillhole legend for more information.
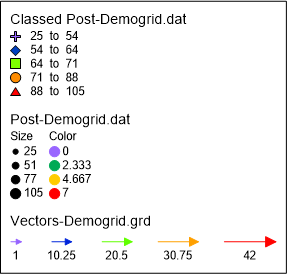
Post Layer Legends
Legends can be displayed for post layers and classed post layers. The post layer legend displays symbols representing the symbol size when proportional sizing is specified. The post layer legend displays symbols representing the symbol color when a color column is specified and the Color method is Numeric via colormap. When both proportional sizing and the Numeric via colormap color method is used, the symbols representing size and color are displayed separately with "Color" and "Size" headers. When neither proportional sizing nor a Numeric via colormap color method is applied to the post layer, a single symbol is displayed. The classed post layer legend displays a symbol for each class and optional information about the class.
Vector Layer Legends
A legend for a vector layer displays scaled vectors with the appropriate value next to each vector. By default, the vector legend displays the minimum and maximum vector length as symbols along with a numeric value for each symbol. This is useful in determining what the vectors on a 1-grid vector or a 2-grid vector layer represent. The vector lengths are set in the Magnitude (data) section on the Scaling page. If the Scaling method on the Symbol page is set to By magnitude, the symbols in the legend are displayed with the minimum and maximum colors.
|
|
|
|
|
One of each layer or symbology legend type is displayed above. |
Legend Properties
To change the legend properties, click once on the legend to select it. The properties for the legend are displayed in the Properties window. The legend properties include the following pages:
General Properties
The General page of the legend properties provides tools for customizing the legend's overall appearance. Here, you can control the Frame and Title properties, including the border around the legend and its title text and font.
|
|
|
Set the frame and title properties in the General page. |
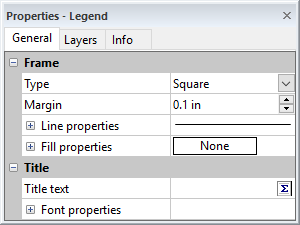
Frame
The Frame section specifies the properties to use for the border around the legend. See the Frame Properties help topic for information on these common properties.
Title
The Title section adds a title for the legend.
Title Text
Click in the box next to Title text and type the title for the legend. The title may include math text instructions. Type the title exactly as you want the text to appear in the legend.
Titles can contain multiple lines. To create a multiple line title, click the  button. The Text Editor appears. Type the text in the dialog. To add a new line of text, press the ENTER key on the keyboard. To change the properties of the text, highlight the text and change the desired property. When finished, click OK. You are returned to the plot window.
Title Font
Click the ![]() next to Font Properties to open the Font Properties section. Set the font properties to use for the legend title here. The legend title and legend class font properties may be set separately.
next to Font Properties to open the Font Properties section. Set the font properties to use for the legend title here. The legend title and legend class font properties may be set separately.
Layers
Select the Layers tab to control which layers are included in the legend and the appearance of the legend. See the Layers help topic for more information.
Info
Select the Info tab to view information about the selected legend.
The information displayed on the Info tab varies based on the type of object you select. Info properties are available for a wide range of objects, including: drawn objects, map objects, axes, and certain map layers.
See the Info help topic for more information.