Grid Values Map
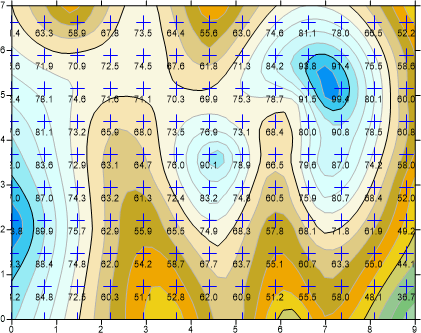
The Home | New Map | Specialty | Grid Values command creates a grid values map. A grid values map indicates the location and values of the grid nodes with symbols and labels. Posting grid values on a map can be useful for visualizing the density of the grid, as well as for verifying the plausibility of your gridded data. The frequency of the plotted grid nodes can be controlled in the X and Y directions independently. The grid values can also be displayed for only a specific range of values. You can specify the symbol type, size, color, and angle for the grid nodes. Associated data values may be placed next to the posted point. The size, angle, color, and typeface for the label can also be specified. Grid lines can also be plotted to help you visualize the grid density.
The Home | Add to Map | Layer| Grid Values or Map Tools | Add to Map | Layer | Grid Values command adds a grid values map layer to the selected map.
Creating a Grid Values Map
To create a new grid values map:
-
Click Home | New Map | Specialty | Grid Values.
-
Select a grid file in the Open Grid dialog. Click Open.
-
If the selected file is in a format that supports 3D grids (e.g. VTK, HDF) the Data Type dialog will be displayed.
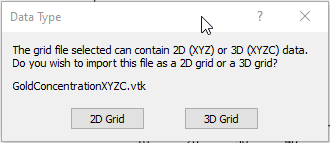
Click 2D Grid to import XYZ data or click 3D Grid to import an XYZC lattice with slice controls. If 2D grid is selected for a 3D grid file, the bottom slice (lowest Z value) will be imported.
The map is automatically created with symbols and labels displayed across the map. The X and Y frequencies are automatically set to display approximately ten rows and ten columns of grid nodes.
Editing an Existing Grid Values Map
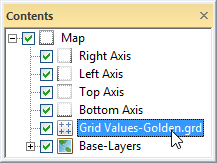
To change the features of the grid values map, click once on the grid values layer in the Contents window or plot window. When the grid values layer is selected, the grid values properties are displayed in the Properties window.
|
|
|
Click on the Grid Values map layer to select it. |
Grid Values Layer Properties
The Properties window for a grid values layer contains the following pages:
Map Properties
The map properties contains the following pages: