Grid Data - Variogram
The Grid Data dialog Variogram page is displayed when the Kriging or Cokriging gridding method is selected on the Select Data page. An important component of the Kriging gridding method is the variogram. The default linear variogram provides a reasonable grid in most circumstances, as long as a nugget effect is not used. A variogram modeling feature is included in Surfer to assist you in selecting the appropriate variogram model for your data. Do not change the variogram components without modeling the variogram first. When in doubt, use the default variogram.
The Variogram page includes the variogram modeling properties as well as a variogram plot and variogram grid.
|
|
|
Specify the variogram or variograms for Kriging and Cokriging methods. |
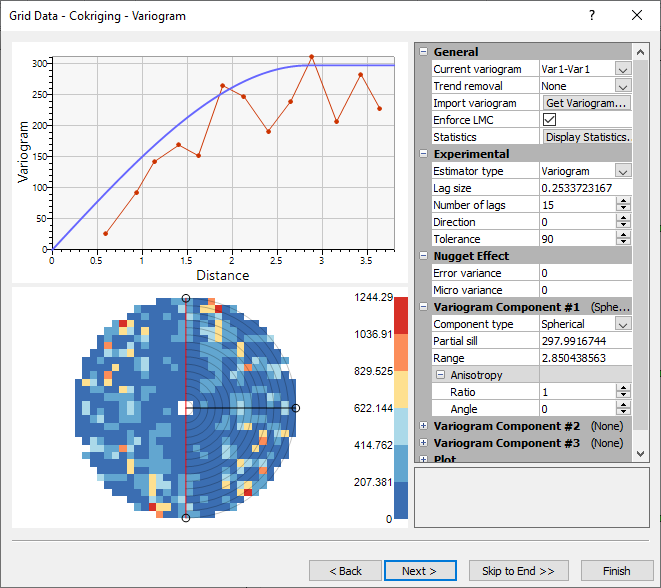
General
The General section includes the options for trend removal, importing variograms, fitting parameters, enforcing constraints, and displaying statistics
Current Variogram
Select which variogram to display in the Variogram page: the self variogram for the primary dataset Var1-Var1, the cross variogram for the primary and secondary datasets Var1-Var2, or the self variogram for the secondary dataset Var2-Var2.
Trend Removal
The Trend Removal list contains three options for detrending the data before creating a variogram. The Trend Removal options carry out a simple polynomial least squares regression of the data and compute the variogram grid for the resulting residuals only. See Section 6.12 in Kitanidis (1997) for a more detailed discussion of detrending data.
-
None should be used most of the time.
-
Linear trend removal should be used when the Kriging algorithm is applied with a linear drift.
-
Quadratic trend removal should be used when the Kriging algorithm is applied with a quadratic drift.
Creating a variogram with Linear or Quadratic trend removal does not automatically change the Kriging options in the Grid Data dialog. You must manually change the Drift Type on the Options page of the Grid Data dialog so that it matches the trend removal of the variogram.
Import Variogram
If you have modeled your data with Surfer's variogram modeling feature (Grids | New Grid | Variogram | New Variogram), click the Get Variogram button to use the variogram results. The Get Variogram button extracts the current variogram model from the variogram modeling subsystem and inserts it into the Variogram Component #1 section. If the variogram includes a nugget effect, these values will be extracted from the variogram model and inserted into the Nugget Effect section. Any data in the Nugget Effect and Variogram Component #1 sections will be overwritten when the Get Variogram command is clicked.
You must have the variogram open in the current plot window to use the Get Variogram option. If more than one variogram is open in the plot window, select the variogram you wish to import in the Select a Variogram dialog.
Enforce LMC
Select the Enforce LMC option to enforce the Linear Model of Coregionalization. This is a set of restrictions for the 3 variograms that will result in a valid system that can be passed to the cokriging algorithm. When Enforce LMC is selected, the structure of the current variogram is copied to the other two variograms. Only the Nugget Effect and Partial sill can be different between variograms when Enforce LMC is selected. Clear the Enforce LMC check box to remove these constraints. Note that invalid variogram parameters can result in the cokriging algorithm failing to converge on a solution when Enforce LMC is not selected.
When Enforce LMC is selected, Surfer performs a test for positive definiteness. A message is displayed if the parameters fail the positive definiteness test. A failed positive definiteness test indicates the variogram system may not be valid.
AutoFit
Click AutoFit to automatically fit the model parameters to the data using the Automatic Variogram Fitting dialog.
Statistics
Click Statistics to display statistics about the data in the Statistics window.
Experimental
The Experimental section includes parameters for the experimental variogram. See the variogram Experimental page for more information on the experimental variogram parameters. The Tolerance and Direction parameters can be modified by clicking and dragging the circle handles on the variogram grid.
Nugget Effect
Specify a nugget effect in the Nugget Effect section by setting the Error variance and Micro variance values. See the Nugget Effect topic for more information on the nugget effect.
Variogram Component
Up to three variogram components may be specified. Select a Component type other than None to add a variogram component. See the variogram topics for more information on the variogram components. To remove a component, set the Component typeNone.
Plot
Select whether or not to display the estimate symbols, estimate line, counts, variance line, and model line in the Plot section.
What's Next?
Click Next to proceed to the Options page. Click Skip to End to proceed directly to the Output page. Click Finish to create the grid file.