Grid Data - Select Data
The Grid Data dialog Select Data page is displayed when the Home | Grid Data | Grid Data command is clicked. Select a data file and interpolation method, filter input data, view data and statistics, and load gridding settings.
|
|
|
Selecting a data file and gridding method is the first step in creating a grid file. |
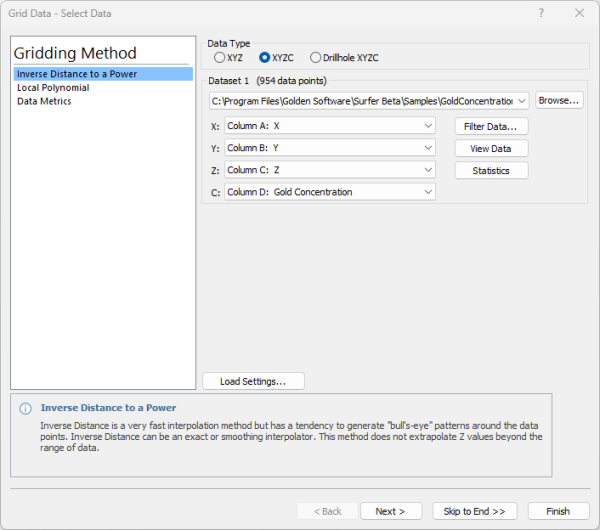
Data Type
In the Data Type field, choose the option appropriate for the data being gridded. Select XYZ to create a 2D Grid from three data columns, X, Y, and Z. Select XYZC to create a 3D Grid from four data columns, X, Y, Z, and C. Select Drillhole XYZC to create a 3D Grid from the drillhole manager.
Dataset
Select a data file to create a grid. Recent files are displayed in the Dataset list. Click Browse to select a data file in the Open Data dialog. Two dataset sections are displayed if the Cokriging method is selected.
Individually specify the columns for the X data, the Y data, the Z data, and, if being used, the C data, in the Dataset section. Surfer defaults to X: Column A, Y: Column B, Z: Column C and C: Column D.
Note: When using date/time formats for any of the Data Columns, the values are stored in the grid as numbers, not in date/time format. To display date/time formats on the map, select the appropriate map part (axis, map layer, or map) and set the date/time label format.
Drillhole Data
|
|
|
Selecting drillhole data to create a 3D grid file. |
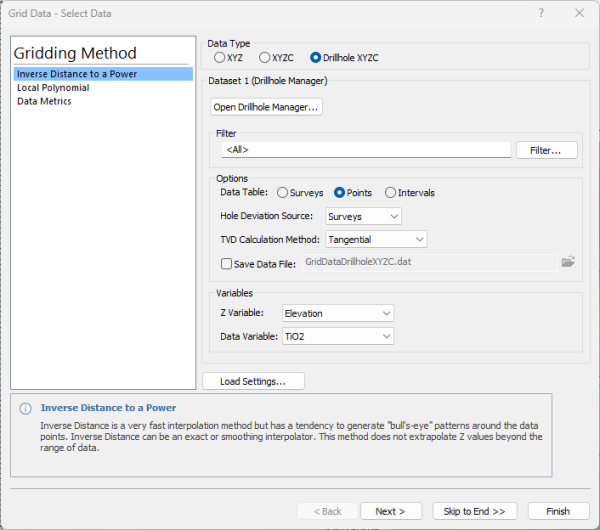
When the Drillhole XYZC data type is selected one of two options will be displayed. If no drillhole data has been loaded into the project, click Import Drillhole Data to complete the drillhole data import process. If drillhole data has already been loaded into the project, the Open Drillhole Manager button will be displayed along with options to define your XYZC dataset. This is similar to saving your drillhole data to an XYZC data file.
Note that if the Grid Data dialog was opened from the Drillhole Manager, the Open Drillhole Manager button will be disabled
Options
Select which Data Table to use by clicking Surveys, Points, or Intervals.
If the XYZ data should follow the well deviation path, specify the Hole Deviation Source for the inclination/dip and azimuth. Select None if no downhole inclination/dip and azimuth data exists.
Select the TVD Calculation Method for calculating the Z values from the measured depth.
To save the XYZC drillhole data used to create the grid, check the box next to Save Data File and specify the output path and file name.
Variables
Select Elevation, TVD, or -TVD as the Z Variable.
Select which Data Variable should be used as the C values for the grid file.
Filter Data
You can filter the data before gridding based on a predefined filter or based on a user-defined equation by clicking the Filter Data button.
View Data
If you are unsure of which columns contain which data variable, click the View Data button to see the data file in a worksheet format. If you get an Insufficient data in worksheet error, use View Data to check the layout of the data. One common reason for this warning is that the data is not numeric or date/time format. After clicking View Data, make sure that all columns of data are right aligned. If one of the columns is left aligned, the data are text, not numbers.
Statistics
Click the Statistics button to display statistics based on the selected data columns.
Gridding Method
Surfer has several different gridding methods. These gridding methods define the way in which the XYZ/XYZC data are interpolated when producing a grid file. Choose the Gridding Method in the Gridding Method list. Refer to the gridding methods help topics for more information on the options.
Load Settings
Click Load Settings to load a grid data settings file in the Open dialog. The grid data settings file stores all of the settings used to create a grid file including gridding method, XYZ columns, limits and spacing, NoData options, cross validation options, and more. Even the settings that are calculated based on the input data file are replaced when a grid data settings file is loaded.
Grid data settings files can be created on the Output page of the Grid Data dialog.
What's Next?
Click Next to proceed to the Variogram page (when Kriging is selected) or Options page. Click Skip to End to proceed directly to the Output page (XYZ or XYZC depending on data type). Click Finish to create the grid file.