Base Symbology
Vector base maps can include symbology. Symbology applies line, fill, and/or symbol properties to features in the base layer depending on an attribute value. The symbology can be included in a legend. The type of symbology and the layer's appearance are controlled in the Symbology dialog. The symbology types in Surfer are:
- Unique Values - Line, fill, and/or symbol properties are specified for unique values in the attribute field.
- Unclassed Colors - Colors from a color spectrum are applied to the features by numeric attribute value.
- Unclassed Symbols - Symbols are added for each polygon feature and scaled proportionally by numeric attribute value, or point features are scaled by numeric attribute value. Unclassed Symbols symbology is not applied to polylines.
- Classed Colors - Colors are applied to the features by classifying numeric attribute values.
- Classed Symbols - Symbols are added for each polygon feature and classified by a numeric attribute value, or point features are classified by a numeric attribute value. Classed Symbols symbology is not applied to polylines.
- Pie Chart - Attributes in the base layer are added as Pie Chart symbols with classified pie slices.
Adding Symbology to a Base Layer
A symbology can be added to a base (vector) layer by clicking Edit Symbology in the Properties window General page. Select the symbology type, specify the attribute field for the symbology, and then specify the various line, fill, and/or symbol properties for the symbology in the Symbology dialog. Click OK or Apply to apply the symbology to the base layer.
To apply symbology, the features in the base (vector) layer must have at least one attribute field. Any of the five symbology types can be applied to an attribute field that contains numeric data. Unique Values symbology can be applied to text or numeric data. Add or edit attribute data in the base layer with the Attribute Table.
The following example uses the NV2010_Population.gsb sample file to create a base map with a symbology:
- Create the base map by clicking Home | New Map | Base.
- Select the NV2010_Population.gsb sample file in the Import dialog. The sample files are located at C:\Program Files\Golden Software\Surfer\Samples by default.
- Click Open in the Import dialog. The base (vector) map is created.
- Click Base(vector)-NV2010_Population.gsb in the Contents window to select the base layer.
- Click General in the Properties window to view the General page.
- Click Edit Symbology in the Symbology field of the Properties window General page. The Symbology dialog opens.
- Click Classed Symbols on the left side of the Symbology dialog to display the Classed Symbols page.
- If Population was not automatically selected in the Attribute field, click the current selection and select Population from the Attribute field list in the General properties section.
- In the Classes properties section, select Natural breaks from the Class method list.
- Click the
 button to reduce the Class counts to 4.
 - In the Symbol properties section, select Square root from the Scaling method list.
- Click the
 next to Symbol properties to expand the symbol properties.
 - Change the symbol by selecting the filled circle (Symbol 12) in the Symbol property list.
- Change the symbol Fill color to Faded Green.
- Click OK and the classed symbol symbology is added to the map.
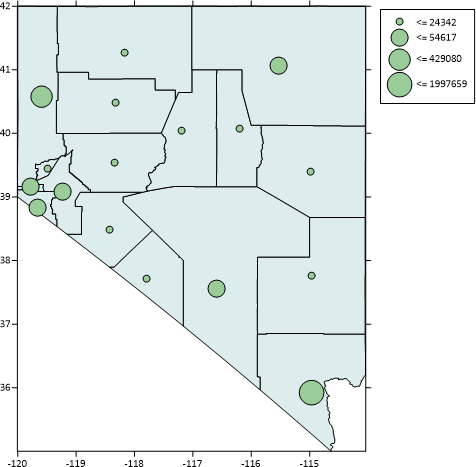
- Click the Map Tools | Add to Map | Legend command to add a legend to the base map. The Classed Symbols legend shows the upper class limit for each class.
|
|
|
The symbology classifies the counties in Nevada by population and displays proportionally sized symbols to indicate the class. The legend indicates the maximum population for each class. |
